
Page 93 - Dynamic Loading and Design of Structures
P. 93
Page 71
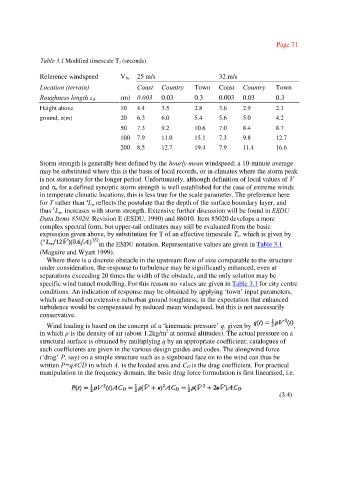
Table 3.1 Modified timescale T s (seconds).
Reference windspeed Vb, 25 m/s 32 m/s
Location (terrain) Coast Country Town Coast Country Town
Roughness length z 0 (m) 0.003 0.03 0.3 0.003 0.03 0.3
Height above 10 4.4 3.5 2.8 3.6 2.9 2.1
ground, z(m) 20 6.3 6.0 5.4 5.6 5.0 4.2
50 7.3 9.2 10.6 7.0 8.4 8.7
100 7.9 11.0 15.1 7.3 9.8 12.7
200 8.5 12.7 19.4 7.9 11.4 16.6
Storm strength is generally best defined by the hourly mean windspeed; a 10-minute average
may be substituted where this is the basis of local records, or in climates where the storm peak
is not stationary for the longer period. Unfortunately, although definition of local values of V
and σ u for a defined synoptic storm strength is well established for the case of extreme winds
in temperate climatic locations, this is less true for the scale parameter. The preference here
x
for T rather than L reflects the postulate that the depth of the surface boundary layer, and
u
x
thus L , increases with storm strength. Extensive further discussion will be found in ESDU
u
Data Items 85020, Revision E (ESDU, 1990) and 86010. Item 85020 develops a more
complex spectral form, but upper-tail ordinates may still be evaluated from the basic
expression given above, by substitution for T of an effective timescale T , which is given by
s
in the ESDU notation. Representative values are given in Table 3.1
(Maguire and Wyatt 1999).
Where there is a discrete obstacle in the upstream flow of size comparable to the structure
under consideration, the response to turbulence may be significantly enhanced, even at
separations exceeding 20 times the width of the obstacle, and the only solution may be
specific wind tunnel modelling. For this reason no values are given in Table 3.1 for city centre
conditions. An indication of response may be obtained by applying ‘town’ input parameters,
which are based on extensive suburban ground roughness, in the expectation that enhanced
turbulence would be compensated by reduced mean windspeed, but this is not necessarily
conservative.
Wind loading is based on the concept of a ‘kinematic pressure’ q, given by ,
2
in which ρis the density of air (about 1.2kg/m at normal altitudes). The actual pressure on a
structural surface is obtained by multiplying q by an appropriate coefficient; catalogues of
such coefficients are given in the various design guides and codes. The alongwind force
(‘drag’ P, say) on a simple structure such as a signboard face on to the wind can thus be
written P=qACD in which A. is the loaded area and CD is the drag coefficient. For practical
manipulation in the frequency domain, the basic drag force formulation is first linearized, i.e.
(3.4)