
Page 98 - Dynamic Loading and Design of Structures
P. 98
Page 75
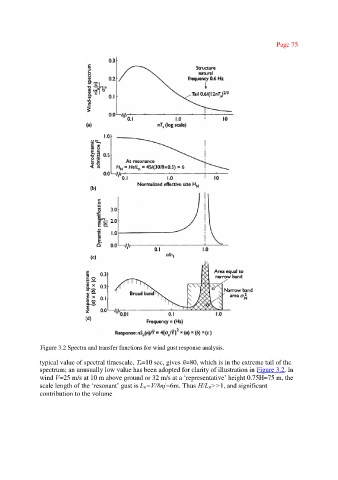
Figure 3.2 Spectra and transfer functions for wind gust response analysis.
typical value of spectral timescale, T s=10 sec, gives ñ=80, which is in the extreme tail of the
spectrum; an unusually low value has been adopted for clarity of illustration in Figure 3.2. In
wind V=25 m/s at 10 m above ground or 32 m/s at a ‘representative’ height 0.75H=75 m, the
scale length of the ‘resonant’ gust is Ln=V/8nj=6m. Thus H/Ln>>1, and significant
contribution to the volume