
Page 165 - Dynamics and Control of Nuclear Reactors
P. 165
162 CHAPTER 12 Pressurized water reactors
simulation include reactivity and core inlet temperature. Selected simulation results
are provided here to illustrate PWR dynamic characteristics.
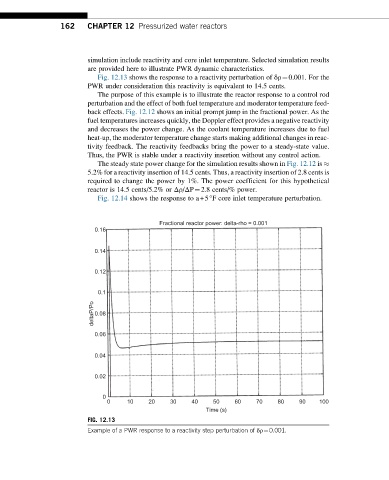
Fig. 12.13 shows the response to a reactivity perturbation of δρ¼0.001. For the
PWR under consideration this reactivity is equivalent to 14.5 cents.
The purpose of this example is to illustrate the reactor response to a control rod
perturbation and the effect of both fuel temperature and moderator temperature feed-
back effects. Fig. 12.12 shows an initial prompt jump in the fractional power. As the
fuel temperatures increases quickly, the Doppler effect provides a negative reactivity
and decreases the power change. As the coolant temperature increases due to fuel
heat-up, the moderator temperature change starts making additional changes in reac-
tivity feedback. The reactivity feedbacks bring the power to a steady-state value.
Thus, the PWR is stable under a reactivity insertion without any control action.
The steady state power change for the simulation results shown in Fig. 12.12 is
5.2% for a reactivity insertion of 14.5 cents. Thus, a reactivity insertion of 2.8 cents is
required to change the power by 1%. The power coefficient for this hypothetical
reactor is 14.5 cents/5.2% or Δρ/ΔP¼2.8 cents/% power.
Fig. 12.14 shows the response to a+5°F core inlet temperature perturbation.
Fractional reactor power: delta-rho = 0.001
0.16
0.14
0.12
0.1
deltaP/Po 0.08
0.06
0.04
0.02
0
0 10 20 30 40 50 60 70 80 90 100
Time (s)
FIG. 12.13
Example of a PWR response to a reactivity step perturbation of δρ¼0.001.