
Page 166 - Dynamics and Control of Nuclear Reactors
P. 166
12.15 Example of a PWR simulation 163
Linearized Model Response: delta-Tcl = 5 deg F
0
–0.01
–0.02
Fractional reactor power, delta-P/Po –0.04
–0.03
–0.05
–0.06
–0.07
–0.08
–0.09
–0.1
0 10 20 30 40 50 60 70 80 90 100
Time (s)
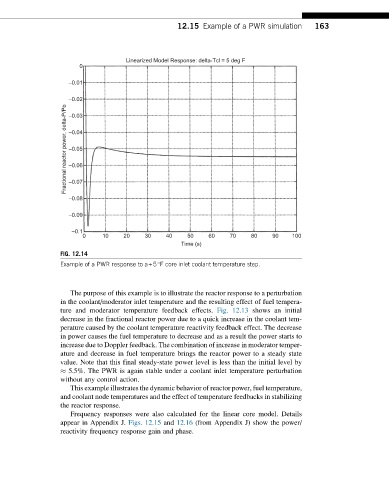
FIG. 12.14
Example of a PWR response to a+5°F core inlet coolant temperature step.
The purpose of this example is to illustrate the reactor response to a perturbation
in the coolant/moderator inlet temperature and the resulting effect of fuel tempera-
ture and moderator temperature feedback effects. Fig. 12.13 shows an initial
decrease in the fractional reactor power due to a quick increase in the coolant tem-
perature caused by the coolant temperature reactivity feedback effect. The decrease
in power causes the fuel temperature to decrease and as a result the power starts to
increase due to Doppler feedback. The combination of increase in moderator temper-
ature and decrease in fuel temperature brings the reactor power to a steady state
value. Note that this final steady-state power level is less than the initial level by
5.5%. The PWR is again stable under a coolant inlet temperature perturbation
without any control action.
This example illustrates the dynamic behavior of reactor power, fuel temperature,
and coolant node temperatures and the effect of temperature feedbacks in stabilizing
the reactor response.
Frequency responses were also calculated for the linear core model. Details
appear in Appendix J. Figs. 12.15 and 12.16 (from Appendix J) show the power/
reactivity frequency response gain and phase.