
Page 167 - Dynamics and Control of Nuclear Reactors
P. 167
164 CHAPTER 12 Pressurized water reactors
1.2
1
0.8
%Power/Cent 0.6
0.4
0.2
0
10 –3 10 –2 10 –1 10 0 10 1 10 2 10 3 10 4
Frequency (rad/s)
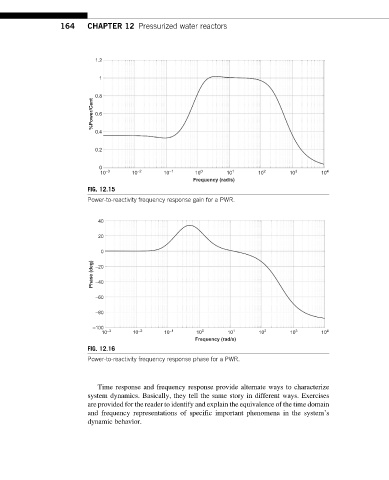
FIG. 12.15
Power-to-reactivity frequency response gain for a PWR.
40
20
0
Phase (deg) –20
–40
–60
–80
–100
10 –3 10 –2 10 –1 10 0 10 1 10 2 10 3 10 4
Frequency (rad/s)
FIG. 12.16
Power-to-reactivity frequency response phase for a PWR.
Time response and frequency response provide alternate ways to characterize
system dynamics. Basically, they tell the same story in different ways. Exercises
are provided for the reader to identify and explain the equivalence of the time domain
and frequency representations of specific important phenomena in the system’s
dynamic behavior.