
Page 288 - Dynamics and Control of Nuclear Reactors
P. 288
290 APPENDIX E Frequency response analysis of linear systems
Example E.4—Cont’d
10 1 0
10
POWER SPECTRUM (1/Hz) 10 –1 PEAK FREQUENCY
–0.38 Hz.
–2
10
10 –3
0.01 0.1 1.0 10
FREQUENCY (Hz)
10 1 0
POWER SPECTRUM (1/Hz) 10 –1 PEAK FREQUENCY
10
–0.35 Hz.
–2
10
10 –3
0.01 0.1 1.0 10
FREQUENCY (Hz)
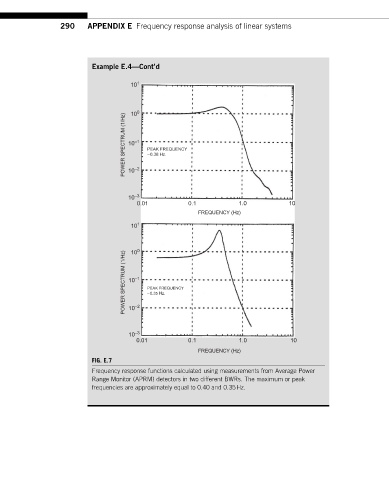
FIG. E.7
Frequency response functions calculated using measurements from Average Power
Range Monitor (APRM) detectors in two different BWRs. The maximum or peak
frequencies are approximately equal to 0.40 and 0.35Hz.