
Page 292 - Dynamics and Control of Nuclear Reactors
P. 292
294 APPENDIX E Frequency response analysis of linear systems
of its strength in a single frequency (its first harmonic). Other binary sequences with
their strengths distributed over a range of frequencies are available. One such
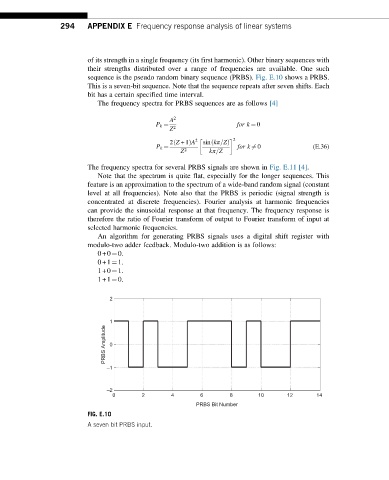
sequence is the pseudo random binary sequence (PRBS). Fig. E.10 shows a PRBS.
This is a seven-bit sequence. Note that the sequence repeats after seven shifts. Each
bit has a certain specified time interval.
The frequency spectra for PRBS sequences are as follows [4]
A 2
P k ¼ for k ¼ 0
Z 2
2 Z +1ÞA 2 sin kπ=ZÞ 2
ð
ð
P k ¼ for k 6¼ 0 (E.36)
Z 2 kπ=Z
The frequency spectra for several PRBS signals are shown in Fig. E.11 [4].
Note that the spectrum is quite flat, especially for the longer sequences. This
feature is an approximation to the spectrum of a wide-band random signal (constant
level at all frequencies). Note also that the PRBS is periodic (signal strength is
concentrated at discrete frequencies). Fourier analysis at harmonic frequencies
can provide the sinusoidal response at that frequency. The frequency response is
therefore the ratio of Fourier transform of output to Fourier transform of input at
selected harmonic frequencies.
An algorithm for generating PRBS signals uses a digital shift register with
modulo-two adder feedback. Modulo-two addition is as follows:
0+0¼0.
0+1¼1.
1+0¼1.
1+1¼0.
2
1
PRBS Amplitude 0
–1
–2
0 2 4 6 8 10 12 14
PRBS Bit Number
FIG. E.10
A seven bit PRBS input.