
Page 287 - Dynamics and Control of Nuclear Reactors
P. 287
APPENDIX E Frequency response analysis of linear systems 289
Bode plots of G(s) = 1/(s**2 + 0.2s + 1), zeta = 0.1
20
10 0
Magnitude (dB) –10
–20
–30
–40
0
–45
Phase (deg) –90
–135
–180
10 –1 10 0 10 1
Frequency (rad/s)
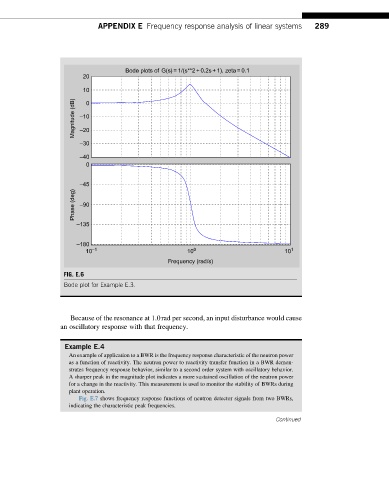
FIG. E.6
Bode plot for Example E.3.
Because of the resonance at 1.0rad per second, an input disturbance would cause
an oscillatory response with that frequency.
Example E.4
An example of application to a BWR is the frequency response characteristic of the neutron power
as a function of reactivity. The neutron power to reactivity transfer function in a BWR demon-
strates frequency response behavior, similar to a second order system with oscillatory behavior.
A sharper peak in the magnitude plot indicates a more sustained oscillation of the neutron power
for a change in the reactivity. This measurement is used to monitor the stability of BWRs during
plant operation.
Fig. E.7 shows frequency response functions of neutron detector signals from two BWRs,
indicating the characteristic peak frequencies.
Continued