
Page 282 - Dynamics and Control of Nuclear Reactors
P. 282
284 APPENDIX E Frequency response analysis of linear systems
Example E.1—Cont’d
ð
φωðÞ ¼ tan 1 ImGjωÞ ¼ tan 1 ð ωÞ (E.17)
ReGjωÞ
ð
These magnitude and phase angle are calculated for selected values of ω. For example, for
ω ¼ 0.1rad/s,
1
f
Re GjωÞg ¼ ¼ 0:99 (E.18a)
ð
1:01
0:1
Im GjωÞg ¼ ¼ 0:099 (E.18b)
f
ð
1:01
h i 1=2
2 2
ð
j GjωÞj ¼ ð 0:99Þ +0:099Þ ¼ 0:995 (E.19)
ð
φ ¼ tan 1 ð 0:1Þ ¼ 5:7degrees (E.20)
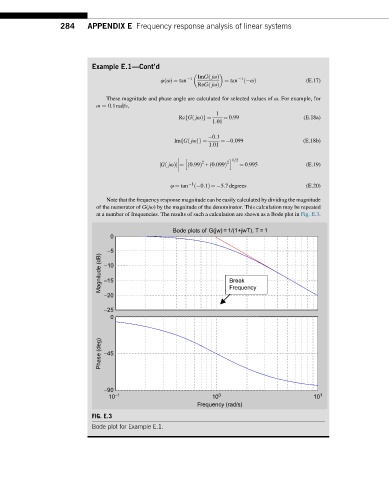
Note that the frequency response magnitude can be easily calculated by dividing the magnitude
of the numerator of G(jω) by the magnitude of the denominator. This calculation may be repeated
at a number of frequencies. The results of such a calculation are shown as a Bode plot in Fig. E.3.
Bode plots of G(jw) = 1/(1+jwT), T = 1
0
–5
Magnitude (dB) –10 Break
–15
–20 Frequency
–25
0
Phase (deg) –45
–90
10 –1 10 0 10 1
Frequency (rad/s)
FIG. E.3
Bode plot for Example E.1.