
Page 73 - Dynamics and Control of Nuclear Reactors
P. 73
6.2 Dynamics of xenon-135 65
25
Reactor shutdown at 100 hr
Iodine-135
20 I-135 reactivity to be lost upon decay to Xe-135
Reactivity loss ($) 15 Xe-135 reactivity loss
10
5 Xenon-135
0
0 20 40 60 80 100 120 140 160 180 200
Time (h)
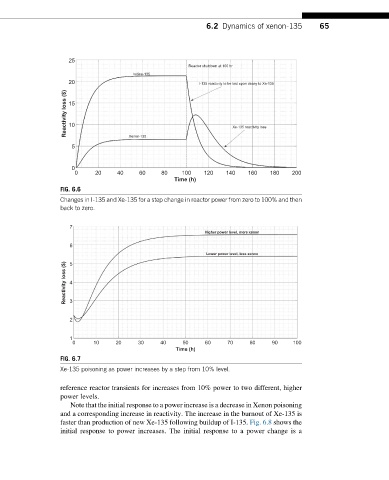
FIG. 6.6
Changes in I-135 and Xe-135 for a step change in reactor power from zero to 100% and then
back to zero.
7
Higher power level, more xenon
6
Lower power level, less xenon
Reactivity loss ($) 4 3
5
2
1
0 10 20 30 40 50 60 70 80 90 100
Time (h)
FIG. 6.7
Xe-135 poisoning as power increases by a step from 10% level.
reference reactor transients for increases from 10% power to two different, higher
power levels.
Note that the initial response to a power increase is a decrease in Xenon poisoning
and a corresponding increase in reactivity. The increase in the burnout of Xe-135 is
faster than production of new Xe-135 following buildup of I-135. Fig. 6.8 shows the
initial response to power increases. The initial response to a power change is a