
Page 75 - Dynamics and Control of Nuclear Reactors
P. 75
6.2 Dynamics of xenon-135 67
20
I-135
15
Reactivity loss ($) 10 Xe-135
5
0
0 20 40 60 80 100 120
Time (h)
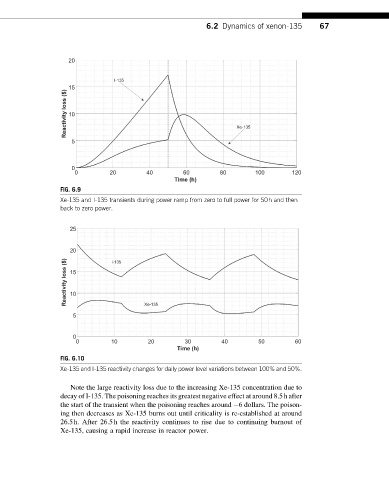
FIG. 6.9
Xe-135 and I-135 transients during power ramp from zero to full power for 50h and then
back to zero power.
25
20 I-135
Reactivity loss ($) 15
10
5 Xe-135
0
0 10 20 30 40 50 60
Time (h)
FIG. 6.10
Xe-135 and I-135 reactivity changes for daily power level variations between 100% and 50%.
Note the large reactivity loss due to the increasing Xe-135 concentration due to
decay of I-135. The poisoning reaches its greatest negative effect at around 8.5h after
the start of the transient when the poisoning reaches around 6 dollars. The poison-
ing then decreases as Xe-135 burns out until criticality is re-established at around
26.5h. After 26.5h the reactivity continues to rise due to continuing burnout of
Xe-135, causing a rapid increase in reactor power.