
Page 78 - Dynamics and Control of Nuclear Reactors
P. 78
70 CHAPTER 6 Fission product poisoning
2
1.5
Reactivity loss ($) 1
0.5
0
0 200 400 600 800 1000 1200
Time (h)
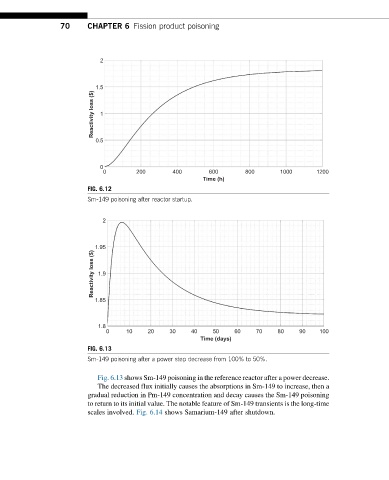
FIG. 6.12
Sm-149 poisoning after reactor startup.
2
1.95
Reactivity loss ($) 1.9
1.85
1.8
0 10 20 30 40 50 60 70 80 90 100
Time (days)
FIG. 6.13
Sm-149 poisoning after a power step decrease from 100% to 50%.
Fig. 6.13 shows Sm-149 poisoning in the reference reactor after a power decrease.
The decreased flux initially causes the absorptions in Sm-149 to increase, then a
gradual reduction in Pm-149 concentration and decay causes the Sm-149 poisoning
to return to its initial value. The notable feature of Sm-149 transients is the long-time
scales involved. Fig. 6.14 shows Samarium-149 after shutdown.