
Page 79 - Dynamics and Control of Nuclear Reactors
P. 79
References 71
2.5
2
Reactivity loss ($) 1.5
1
0.5
0
0 500 1000 1500 2000 2500 3000
Time (h)
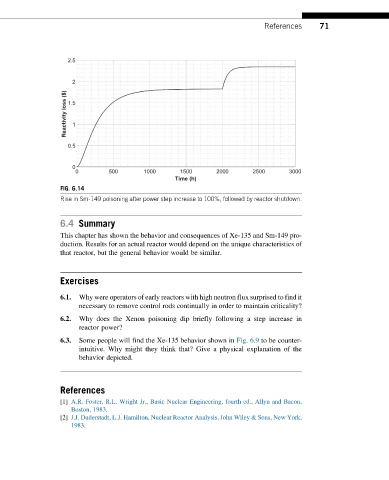
FIG. 6.14
Rise in Sm-149 poisoning after power step increase to 100%, followed by reactor shutdown.
6.4 Summary
This chapter has shown the behavior and consequences of Xe-135 and Sm-149 pro-
duction. Results for an actual reactor would depend on the unique characteristics of
that reactor, but the general behavior would be similar.
Exercises
6.1. Why were operators of early reactors with high neutron flux surprised to find it
necessary to remove control rods continually in order to maintain criticality?
6.2. Why does the Xenon poisoning dip briefly following a step increase in
reactor power?
6.3. Some people will find the Xe-135 behavior shown in Fig. 6.9 to be counter-
intuitive. Why might they think that? Give a physical explanation of the
behavior depicted.
References
[1] A.R. Foster, R.L. Wright Jr., Basic Nuclear Engineering, fourth ed., Allyn and Bacon,
Boston, 1983.
[2] J.J. Duderstadt, L.J. Hamilton, Nuclear Reactor Analysis, John Wiley & Sons, New York,
1983.