
Page 74 - Dynamics and Control of Nuclear Reactors
P. 74
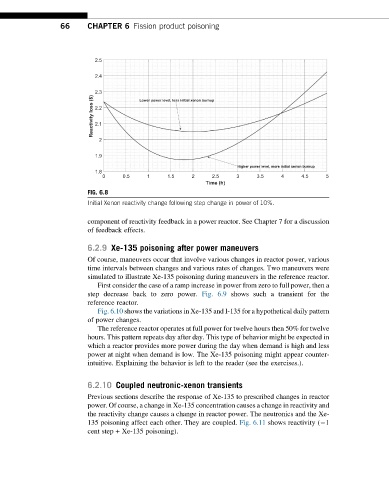
66     CHAPTER 6 Fission product poisoning


                           2.5

                           2.4

                           2.3          Lower power level, less initial xenon burnup
                           Reactivity loss ($)  2.2


                           2.1

                             2

                           1.9
                                                                   Higher power level, more initial xenon burnup
                           1.8
                             0     0.5    1    1.5    2     2.5    3    3.5    4     4.5   5
                                                          Time (h)
                         FIG. 6.8
                         Initial Xenon reactivity change following step change in power of 10%.

                         component of reactivity feedback in a power reactor. See Chapter 7 for a discussion
                         of feedback effects.

                         6.2.9 Xe-135 poisoning after power maneuvers
                         Of course, maneuvers occur that involve various changes in reactor power, various
                         time intervals between changes and various rates of changes. Two maneuvers were
                         simulated to illustrate Xe-135 poisoning during maneuvers in the reference reactor.
                            First consider the case of a ramp increase in power from zero to full power, then a
                         step decrease back to zero power. Fig. 6.9 shows such a transient for the
                         reference reactor.
                            Fig. 6.10 shows the variations in Xe-135 and I-135 for a hypothetical daily pattern
                         of power changes.
                            The reference reactor operates at full power for twelve hours then 50% for twelve
                         hours. This pattern repeats day after day. This type of behavior might be expected in
                         which a reactor provides more power during the day when demand is high and less
                         power at night when demand is low. The Xe-135 poisoning might appear counter-
                         intuitive. Explaining the behavior is left to the reader (see the exercises.).


                         6.2.10 Coupled neutronic-xenon transients
                         Previous sections describe the response of Xe-135 to prescribed changes in reactor
                         power. Of course, a change in Xe-135 concentration causes a change in reactivity and
                         the reactivity change causes a change in reactor power. The neutronics and the Xe-
                         135 poisoning affect each other. They are coupled. Fig. 6.11 shows reactivity ( 1
                         cent step + Xe-135 poisoning).