
Page 275 - E-Bussiness and E-Commerce Management Strategy, Implementation, and Practice
P. 275
M04_CHAF9601_04_SE_C04.QXD:D01_CHAF7409_04_SE_C01.QXD 16/4/09 11:11 Page 242
242 Part 1 Introduction
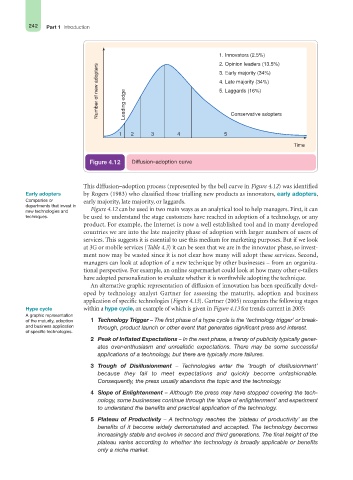
Figure 4.12 Diffusion–adoption curve
This diffusion–adoption process (represented by the bell curve in Figure 4.12) was identified
Early adopters by Rogers (1983) who classified those trialling new products as innovators, early adopters,
Companies or early majority, late majority, or laggards.
departments that invest in
new technologies and Figure 4.12 can be used in two main ways as an analytical tool to help managers. First, it can
techniques. be used to understand the stage customers have reached in adoption of a technology, or any
product. For example, the Internet is now a well established tool and in many developed
countries we are into the late majority phase of adoption with larger numbers of users of
services. This suggests it is essential to use this medium for marketing purposes. But if we look
at 3G or mobile services (Table 4.3) it can be seen that we are in the innovator phase, so invest-
ment now may be wasted since it is not clear how many will adopt these services. Second,
managers can look at adoption of a new technique by other businesses – from an organiza-
tional perspective. For example, an online supermarket could look at how many other e-tailers
have adopted personalization to evaluate whether it is worthwhile adopting the technique.
An alternative graphic representation of diffusion of innovation has been specifically devel-
oped by technology analyst Gartner for assessing the maturity, adoption and business
application of specific technologies (Figure 4.13). Gartner (2005) recognizes the following stages
Hype cycle within a hype cycle, an example of which is given in Figure 4.13 for trends current in 2005:
A graphic representation
of the maturity, adoption 1 Technology Trigger – The first phase of a hype cycle is the ‘technology trigger’ or break-
and business application through, product launch or other event that generates significant press and interest.
of specific technologies.
2 Peak of Inflated Expectations – In the next phase, a frenzy of publicity typically gener-
ates over-enthusiasm and unrealistic expectations. There may be some successful
applications of a technology, but there are typically more failures.
3 Trough of Disillusionment – Technologies enter the ‘trough of disillusionment’
because they fail to meet expectations and quickly become unfashionable.
Consequently, the press usually abandons the topic and the technology.
4 Slope of Enlightenment – Although the press may have stopped covering the tech-
nology, some businesses continue through the ‘slope of enlightenment’ and experiment
to understand the benefits and practical application of the technology.
5 Plateau of Productivity – A technology reaches the ‘plateau of productivity’ as the
benefits of it become widely demonstrated and accepted. The technology becomes
increasingly stable and evolves in second and third generations. The final height of the
plateau varies according to whether the technology is broadly applicable or benefits
only a niche market.