
Page 124 - Earth's Climate Past and Future
P. 124
100 PART II • Tectonic-Scale Climate Change
0 The most important climatic record in the ocean is
the oxygen isotope signal (see Appendix 1 for a full
summary). Most of the oxygen in nature occurs as the
very abundant O isotope or as the much less abundant
16
10
18 O isotope. Scientists refer to changes in the relative
amounts of these two isotopes as variations in δ O,
18
measured as changes in parts per thousand (‰).
20 18
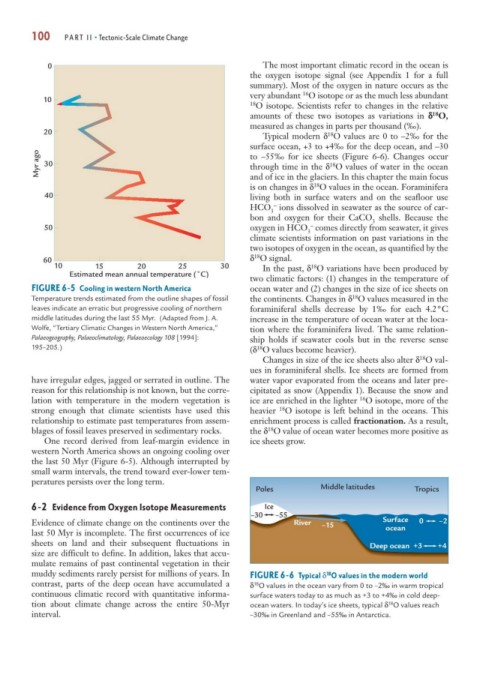
Typical modern δ O values are 0 to –2‰ for the
surface ocean, +3 to +4‰ for the deep ocean, and –30
Myr ago 30 to –55‰ for ice sheets (Figure 6-6). Changes occur
through time in the δ O values of water in the ocean
18
and of ice in the glaciers. In this chapter the main focus
is on changes in δ O values in the ocean. Foraminifera
18
40 living both in surface waters and on the seafloor use
HCO ions dissolved in seawater as the source of car-
–
3
bon and oxygen for their CaCO shells. Because the
3
–
50 oxygen in HCO comes directly from seawater, it gives
3
climate scientists information on past variations in the
two isotopes of oxygen in the ocean, as quantified by the
18
60 δ O signal.
10 15 20 25 30 In the past, δ O variations have been produced by
18
Estimated mean annual temperature (˚C)
two climatic factors: (1) changes in the temperature of
FIGURE 6-5 Cooling in western North America ocean water and (2) changes in the size of ice sheets on
18
Temperature trends estimated from the outline shapes of fossil the continents. Changes in δ O values measured in the
leaves indicate an erratic but progressive cooling of northern foraminiferal shells decrease by 1‰ for each 4.2°C
middle latitudes during the last 55 Myr. (Adapted from J. A. increase in the temperature of ocean water at the loca-
Wolfe, “Tertiary Climatic Changes in Western North America,” tion where the foraminifera lived. The same relation-
Palaeogeography, Palaeoclimatology, Palaeoecology 108 [1994]: ship holds if seawater cools but in the reverse sense
195–205.) (δ O values become heavier).
18
18
Changes in size of the ice sheets also alter δ O val-
ues in foraminiferal shells. Ice sheets are formed from
have irregular edges, jagged or serrated in outline. The water vapor evaporated from the oceans and later pre-
reason for this relationship is not known, but the corre- cipitated as snow (Appendix 1). Because the snow and
16
lation with temperature in the modern vegetation is ice are enriched in the lighter O isotope, more of the
strong enough that climate scientists have used this heavier O isotope is left behind in the oceans. This
18
relationship to estimate past temperatures from assem- enrichment process is called fractionation. As a result,
blages of fossil leaves preserved in sedimentary rocks. the δ O value of ocean water becomes more positive as
18
One record derived from leaf-margin evidence in ice sheets grow.
western North America shows an ongoing cooling over
the last 50 Myr (Figure 6-5). Although interrupted by
small warm intervals, the trend toward ever-lower tem-
peratures persists over the long term.
Poles Middle latitudes Tropics
6-2 Evidence from Oxygen Isotope Measurements Ice
–30 –55
Evidence of climate change on the continents over the River –15 Surface 0 –2
ocean
last 50 Myr is incomplete. The first occurrences of ice
sheets on land and their subsequent fluctuations in Deep ocean +3 +4
size are difficult to define. In addition, lakes that accu-
mulate remains of past continental vegetation in their
muddy sediments rarely persist for millions of years. In FIGURE 6-6 Typical δ O values in the modern world
18
contrast, parts of the deep ocean have accumulated a δ O values in the ocean vary from 0 to –2‰ in warm tropical
18
continuous climatic record with quantitative informa- surface waters today to as much as +3 to +4‰ in cold deep-
tion about climate change across the entire 50-Myr ocean waters. In today’s ice sheets, typical δ O values reach
18
interval. –30‰ in Greenland and –55‰ in Antarctica.