
Page 125 - Earth's Climate Past and Future
P. 125
CHAPTER 6 • From Greenhouse to Icehouse: The Last 50 Million Years 101
The opposite is true if ice melts. If all the ice present 0
on Antarctica and Greenland today melted and flowed Later phase:
back to the ocean, it would deliver a large volume of Ice sheet growth
16 O-rich meltwater that would shift the ocean’s average 10 and > 7˚C additional
18
18
δ O value (δ O ) from its present value of 0‰ to a cooling of deep water
w
value of –1‰.
A simple equation summarizes these processes: 20
Some
18
Δδ O = Δδ O × 0.23ΔT
18
c w Antarctic
where Δ means “change in.” This equation indicates Myr ago 30 ice present Early phase:
18
that measured changes in δ O values in the shells of > 6˚C cooling of
foraminifera (Δδ O ) result from changes in the mean 40 No deep water
18
c
18
18
δ O value of the oceans (Δδ O ) and from variations known
w
in the temperature of the water in which the shell 50 ice
formed (ΔT). The value 0.23 results from inverting the
4.2 value noted earlier (1/4.2 = 0.23).
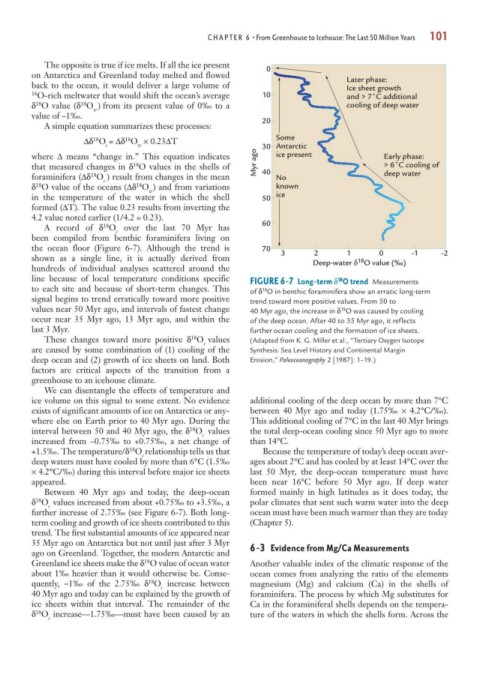
A record of δ O over the last 70 Myr has 60
18
c
been compiled from benthic foraminifera living on
the ocean floor (Figure 6-7). Although the trend is 70
0
1
2
shown as a single line, it is actually derived from 3 Deep-water δ O value (‰) -1 -2
18
hundreds of individual analyses scattered around the
line because of local temperature conditions specific FIGURE 6-7 Long-term δ O trend Measurements
18
to each site and because of short-term changes. This of δ O in benthic foraminifera show an erratic long-term
18
signal begins to trend erratically toward more positive trend toward more positive values. From 50 to
values near 50 Myr ago, and intervals of fastest change 40 Myr ago, the increase in δ O was caused by cooling
18
occur near 35 Myr ago, 13 Myr ago, and within the of the deep ocean. After 40 to 35 Myr ago, it reflects
last 3 Myr. further ocean cooling and the formation of ice sheets.
These changes toward more positive δ O values (Adapted from K. G. Miller et al., “Tertiary Oxygen Isotope
18
c
are caused by some combination of (1) cooling of the Synthesis: Sea Level History and Continental Margin
deep ocean and (2) growth of ice sheets on land. Both Erosion,” Paleoceanography 2 [1987]: 1–19.)
factors are critical aspects of the transition from a
greenhouse to an icehouse climate.
We can disentangle the effects of temperature and
ice volume on this signal to some extent. No evidence additional cooling of the deep ocean by more than 7°C
exists of significant amounts of ice on Antarctica or any- between 40 Myr ago and today (1.75‰ × 4.2°C/‰).
where else on Earth prior to 40 Myr ago. During the This additional cooling of 7°C in the last 40 Myr brings
interval between 50 and 40 Myr ago, the δ O values the total deep-ocean cooling since 50 Myr ago to more
18
c
increased from –0.75‰ to +0.75‰, a net change of than 14°C.
18
+1.5‰. The temperature/δ O relationship tells us that Because the temperature of today’s deep ocean aver-
c
deep waters must have cooled by more than 6°C (1.5‰ ages about 2°C and has cooled by at least 14°C over the
× 4.2°C/‰) during this interval before major ice sheets last 50 Myr, the deep-ocean temperature must have
appeared. been near 16°C before 50 Myr ago. If deep water
Between 40 Myr ago and today, the deep-ocean formed mainly in high latitudes as it does today, the
δ O values increased from about +0.75‰ to +3.5‰, a polar climates that sent such warm water into the deep
18
c
further increase of 2.75‰ (see Figure 6-7). Both long- ocean must have been much warmer than they are today
term cooling and growth of ice sheets contributed to this (Chapter 5).
trend. The first substantial amounts of ice appeared near
35 Myr ago on Antarctica but not until just after 3 Myr
ago on Greenland. Together, the modern Antarctic and 6-3 Evidence from Mg/Ca Measurements
Greenland ice sheets make the δ O value of ocean water Another valuable index of the climatic response of the
18
about 1‰ heavier than it would otherwise be. Conse- ocean comes from analyzing the ratio of the elements
quently, ~1‰ of the 2.75‰ δ O increase between magnesium (Mg) and calcium (Ca) in the shells of
18
c
40 Myr ago and today can be explained by the growth of foraminifera. The process by which Mg substitutes for
ice sheets within that interval. The remainder of the Ca in the foraminiferal shells depends on the tempera-
δ O increase—1.75‰—must have been caused by an ture of the waters in which the shells form. Across the
18
c