
Page 126 - Earth's Climate Past and Future
P. 126
102 PART II • Tectonic-Scale Climate Change
temperature range of the deep ocean, the relationship Do Changes in Geography Explain the
18
is nearly linear. As was the case with the δ O signal, Cooling?
adjustments must also be made for long-term changes
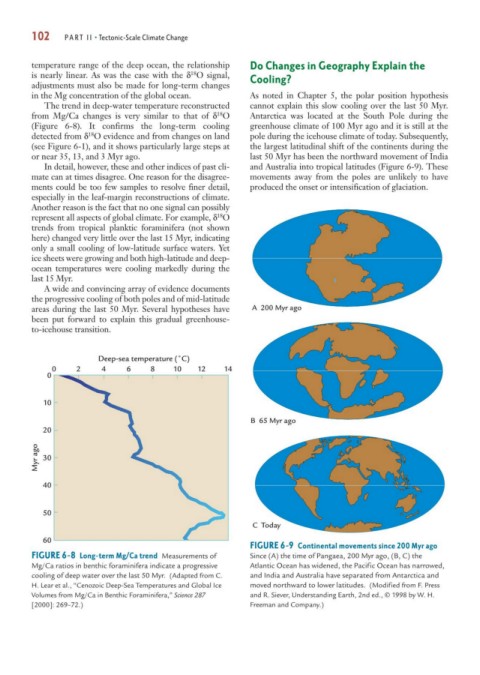
in the Mg concentration of the global ocean. As noted in Chapter 5, the polar position hypothesis
The trend in deep-water temperature reconstructed cannot explain this slow cooling over the last 50 Myr.
18
from Mg/Ca changes is very similar to that of δ O Antarctica was located at the South Pole during the
(Figure 6-8). It confirms the long-term cooling greenhouse climate of 100 Myr ago and it is still at the
18
detected from δ O evidence and from changes on land pole during the icehouse climate of today. Subsequently,
(see Figure 6-1), and it shows particularly large steps at the largest latitudinal shift of the continents during the
or near 35, 13, and 3 Myr ago. last 50 Myr has been the northward movement of India
In detail, however, these and other indices of past cli- and Australia into tropical latitudes (Figure 6-9). These
mate can at times disagree. One reason for the disagree- movements away from the poles are unlikely to have
ments could be too few samples to resolve finer detail, produced the onset or intensification of glaciation.
especially in the leaf-margin reconstructions of climate.
Another reason is the fact that no one signal can possibly
18
represent all aspects of global climate. For example, δ O
trends from tropical planktic foraminifera (not shown
here) changed very little over the last 15 Myr, indicating
only a small cooling of low-latitude surface waters. Yet
ice sheets were growing and both high-latitude and deep-
ocean temperatures were cooling markedly during the
last 15 Myr.
A wide and convincing array of evidence documents
the progressive cooling of both poles and of mid-latitude
areas during the last 50 Myr. Several hypotheses have A 200 Myr ago
been put forward to explain this gradual greenhouse-
to-icehouse transition.
Deep-sea temperature (˚C)
0 2 4 6 8 10 12 14
0
10
B 65 Myr ago
20
Myr ago 30
40
50
C Today
60
FIGURE 6-9 Continental movements since 200 Myr ago
FIGURE 6-8 Long-term Mg/Ca trend Measurements of Since (A) the time of Pangaea, 200 Myr ago, (B, C) the
Mg/Ca ratios in benthic foraminifera indicate a progressive Atlantic Ocean has widened, the Pacific Ocean has narrowed,
cooling of deep water over the last 50 Myr. (Adapted from C. and India and Australia have separated from Antarctica and
H. Lear et al., “Cenozoic Deep-Sea Temperatures and Global Ice moved northward to lower latitudes. (Modified from F. Press
Volumes from Mg/Ca in Benthic Foraminifera,” Science 287 and R. Siever, Understanding Earth, 2nd ed., © 1998 by W. H.
[2000]: 269–72.) Freeman and Company.)