
Page 129 - Earth's Climate Past and Future
P. 129
CHAPTER 6 • From Greenhouse to Icehouse: The Last 50 Million Years 105
Relative production
IN SUMMARY, it seems unlikely that such and consumption
discontinuous gateway episodes could have driven a of ocean crust vs. today
progressive climatic cooling for 50 Myr. 0.8 1.0 1.2 1.4 1.6
0
Whether or not gateway changes affect climate on a
global scale, they certainly have the potential to alter the 10 Spreading
flow of deep and bottom water. Major gateway changes
redistribute heat and salt at the high-latitude sites where 20
deep waters form, and changes in these surface-water
properties may affect formation of deep water. For Spreading and
example, the model experiments indicated that closing Myr ago 30 mid-plate
the Isthmus of Panama increased the formation of deep volcanism
water in the high latitudes of the North Atlantic. For- 40
mation of deep water increased in this simulation
because of the increased salinity of northward-flowing
Gulf Stream waters (see Figure 6-11). Higher-salinity 50
surface waters promote stronger deep-water formation
because the water is already dense when it encounters
cold winter air masses at high latitudes. The results from 60
this experiment agree with independent evidence that
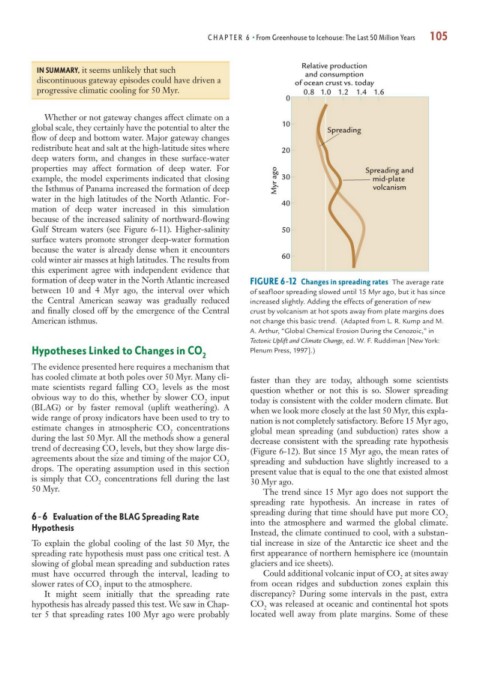
formation of deep water in the North Atlantic increased FIGURE 6-12 Changes in spreading rates The average rate
between 10 and 4 Myr ago, the interval over which of seafloor spreading slowed until 15 Myr ago, but it has since
the Central American seaway was gradually reduced increased slightly. Adding the effects of generation of new
and finally closed off by the emergence of the Central crust by volcanism at hot spots away from plate margins does
American isthmus. not change this basic trend. (Adapted from L. R. Kump and M.
A. Arthur, “Global Chemical Erosion During the Cenozoic,” in
Tectonic Uplift and Climate Change, ed. W. F. Ruddiman [New York:
Hypotheses Linked to Changes in CO Plenum Press, 1997].)
2
The evidence presented here requires a mechanism that
has cooled climate at both poles over 50 Myr. Many cli- faster than they are today, although some scientists
mate scientists regard falling CO levels as the most
2 question whether or not this is so. Slower spreading
obvious way to do this, whether by slower CO input
2 today is consistent with the colder modern climate. But
(BLAG) or by faster removal (uplift weathering). A when we look more closely at the last 50 Myr, this expla-
wide range of proxy indicators have been used to try to nation is not completely satisfactory. Before 15 Myr ago,
estimate changes in atmospheric CO concentrations
2 global mean spreading (and subduction) rates show a
during the last 50 Myr. All the methods show a general decrease consistent with the spreading rate hypothesis
trend of decreasing CO levels, but they show large dis-
2 (Figure 6-12). But since 15 Myr ago, the mean rates of
agreements about the size and timing of the major CO
2 spreading and subduction have slightly increased to a
drops. The operating assumption used in this section present value that is equal to the one that existed almost
is simply that CO concentrations fell during the last
2 30 Myr ago.
50 Myr. The trend since 15 Myr ago does not support the
spreading rate hypothesis. An increase in rates of
spreading during that time should have put more CO
6-6 Evaluation of the BLAG Spreading Rate 2
Hypothesis into the atmosphere and warmed the global climate.
Instead, the climate continued to cool, with a substan-
To explain the global cooling of the last 50 Myr, the tial increase in size of the Antarctic ice sheet and the
spreading rate hypothesis must pass one critical test. A first appearance of northern hemisphere ice (mountain
slowing of global mean spreading and subduction rates glaciers and ice sheets).
must have occurred through the interval, leading to Could additional volcanic input of CO at sites away
2
slower rates of CO input to the atmosphere. from ocean ridges and subduction zones explain this
2
It might seem initially that the spreading rate discrepancy? During some intervals in the past, extra
hypothesis has already passed this test. We saw in Chap- CO was released at oceanic and continental hot spots
2
ter 5 that spreading rates 100 Myr ago were probably located well away from plate margins. Some of these