
Page 254 - Earth's Climate Past and Future
P. 254
230 PART IV • Deglacial Climate Changes
Fire and Ice: Shift in the Balance of Power theory (Chapter 9) predicts that the orbitally produced
maximum in summer insolation near 10,000 years ago
The main factors that explain why climate 21,000 years in the northern hemisphere should have caused signifi-
ago was different from climate today are the larger ice cantly higher rates of ice melting.
sheets and the lower atmospheric greenhouse-gas levels It might seem that the way to quantify the rate of ice
(primarily CO ). During the subsequent deglaciation, a
2 melting is to measure the gradual retreat of the ice sheet
shift occurred in the balance of power among the fac- margins. Radiocarbon dating of material found in,
tors that controlled global climate (Figure 13–1). Sum- under, or atop hundreds of moraines deposited by the
mer and winter insolation values that had been near ice shows that the retreat of the large ice sheet in North
modern levels during the last glacial maximum began to America began near 15,000 C years ago, reached a
14
change. By 10,000 years ago, the angle of tilt of Earth’s midpoint near 10,000 C years ago, and ended by 6000
14
axis had reached a maximum at the same time that 14 C years ago (Figure 13–2). The smaller Scandinavian
Earth’s precessional motion moved it closest to the Sun ice sheet began to retreat at the same time as the one in
on June 21. These orbital changes combined to produce North America, but it disappeared a few thousand years
a summer insolation maximum at all latitudes of the earlier. The timing of these retreats agrees with the
northern hemisphere. Milankovitch theory.
The rise in summer insolation at higher northern Knowing the area covered by the retreating ice is a
latitudes triggered melting of the northern ice sheets. good start, but a complete analysis requires that these
As the ice sheets melted, their influence on climate measurements be converted to ice volume. To make this
diminished, and the insolation anomalies (the depar- conversion, we need to know the thickness of the ice as
tures from modern levels) became more important. The it retreated (thickness × area = volume). To complicate
most recent deglaciation is mainly a story of this shift in this analysis, the thickness of an ice sheet can be
the balance of power from ice (sheets) to fire (solar affected by the conditions in its basal layer. Portions of
insolation). A second important change during this ice sheets that repeatedly slide on their bases are thin
deglaciation was the increase in atmospheric CO con-
2 and relatively low in volume for a given area; portions
centrations from 190 to 280 ppm, along with a doubling that are frozen to their beds are thicker and larger in
of methane levels. The increases in greenhouse gases volume for the same area. Because of this uncertainty
coincided closely with ice melting. about thickness, records of changing ice area through
time do not guarantee valid records of ice volume.
13-1 When Did the Ice Sheets Melt?
13-2 Coral Reefs and Rising Sea Level
Abundant evidence available from the recent deglacia-
tion gives us an unusual opportunity to test explana- The best record of ice sheet melting comes from tropi-
tions about how deglaciations occur. The Milankovitch cal coral reefs far from the polar ice sheets (Chapter 9).
Solar radiation departure from modern levels
2
(W/m )
–20 –10 0 +10 +20 +30
0
5000 Winter Summer
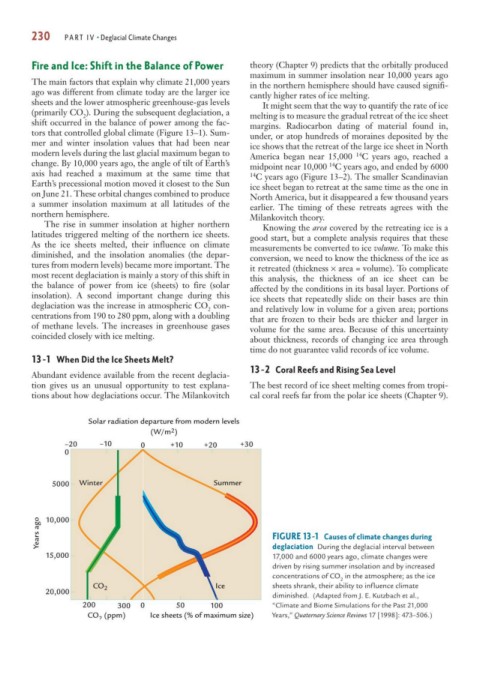
Years ago 10,000 FIGURE 13-1 Causes of climate changes during
15,000 deglaciation During the deglacial interval between
17,000 and 6000 years ago, climate changes were
driven by rising summer insolation and by increased
concentrations of CO in the atmosphere; as the ice
2
CO 2 Ice sheets shrank, their ability to influence climate
20,000
diminished. (Adapted from J. E. Kutzbach et al.,
200 300 0 50 100 “Climate and Biome Simulations for the Past 21,000
CO (ppm) Ice sheets (% of maximum size) Years,” Quaternary Science Reviews 17 [1998]: 473–506.)
2