
Page 256 - Earth's Climate Past and Future
P. 256
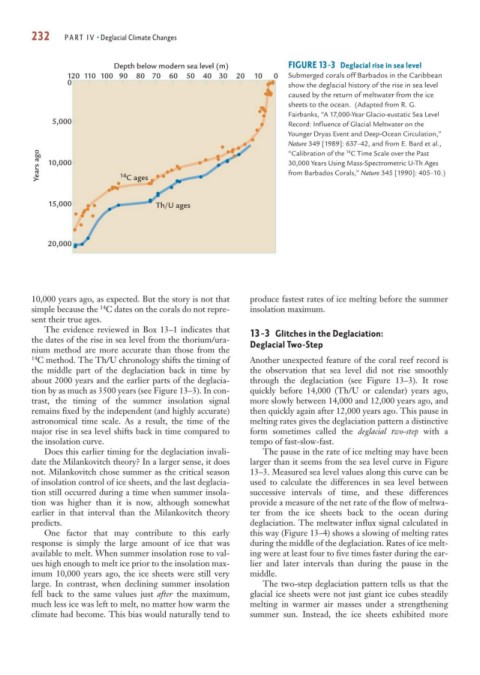
232     PART IV • Deglacial Climate Changes


                            Depth below modern sea level (m)         FIGURE 13-3 Deglacial rise in sea level
                 120  110  100  90  80  70  60  50  40 30  20  10  0  Submerged corals off Barbados in the Caribbean
                 0                                                   show the deglacial history of the rise in sea level
                                                                     caused by the return of meltwater from the ice
                                                                     sheets to the ocean. (Adapted from R. G.
                                                                     Fairbanks, “A 17,000-Year Glacio-eustatic Sea Level
             5,000                                                   Record: Influence of Glacial Meltwater on the
                                                                     Younger Dryas Event and Deep-Ocean Circulation,”
                                                                     Nature 349 [1989]: 637–42, and from E. Bard et al.,
          Years ago  10,000  14 C ages                               30,000 Years Using Mass-Spectrometric U-Th Ages
                                                                     “Calibration of the  C Time Scale over the Past
                                                                                   14
                                                                     from Barbados Corals,” Nature 345 [1990]: 405–10.)


            15,000                    Th/U ages


            20,000


        10,000 years ago, as expected. But the story is not that  produce fastest rates of ice melting before the summer
                         14
        simple because the  C dates on the corals do not repre-  insolation maximum.
        sent their true ages.
           The evidence reviewed in Box 13–1 indicates that  13-3 Glitches in the Deglaciation:
        the dates of the rise in sea level from the thorium/ura-  Deglacial Two-Step
        nium method are more accurate than those from the
        14 C method. The Th/U chronology shifts the timing of  Another unexpected feature of the coral reef record is
        the middle part of the deglaciation back in time by  the observation that sea level did not rise smoothly
        about 2000 years and the earlier parts of the deglacia-  through the deglaciation (see Figure 13–3). It rose
        tion by as much as 3500 years (see Figure 13–3). In con-  quickly before 14,000 (Th/U or calendar) years ago,
        trast, the timing of the summer insolation signal   more slowly between 14,000 and 12,000 years ago, and
        remains fixed by the independent (and highly accurate)  then quickly again after 12,000 years ago. This pause in
        astronomical time scale. As a result, the time of the  melting rates gives the deglaciation pattern a distinctive
        major rise in sea level shifts back in time compared to  form sometimes called the  deglacial two-step with a
        the insolation curve.                               tempo of fast-slow-fast.
           Does this earlier timing for the deglaciation invali-  The pause in the rate of ice melting may have been
        date the Milankovitch theory? In a larger sense, it does  larger than it seems from the sea level curve in Figure
        not. Milankovitch chose summer as the critical season  13–3. Measured sea level values along this curve can be
        of insolation control of ice sheets, and the last deglacia-  used to calculate the differences in sea level between
        tion still occurred during a time when summer insola-  successive intervals of time, and these differences
        tion was higher than it is now, although somewhat   provide a measure of the net rate of the flow of meltwa-
        earlier in that interval than the Milankovitch theory  ter from the ice sheets back to the ocean during
        predicts.                                           deglaciation. The meltwater influx signal calculated in
           One factor that may contribute to this early     this way (Figure 13–4) shows a slowing of melting rates
        response is simply the large amount of ice that was  during the middle of the deglaciation. Rates of ice melt-
        available to melt. When summer insolation rose to val-  ing were at least four to five times faster during the ear-
        ues high enough to melt ice prior to the insolation max-  lier and later intervals than during the pause in the
        imum 10,000 years ago, the ice sheets were still very  middle.
        large. In contrast, when declining summer insolation   The two-step deglaciation pattern tells us that the
        fell back to the same values just  after the maximum,  glacial ice sheets were not just giant ice cubes steadily
        much less ice was left to melt, no matter how warm the  melting in warmer air masses under a strengthening
        climate had become. This bias would naturally tend to  summer sun. Instead, the ice sheets exhibited more