
Page 255 - Earth's Climate Past and Future
P. 255
CHAPTER 13 • Climate During and Since the Last Deglaciation 231
10
Greenland
Arctic
12 6
7
10
12 9
8
10
12
12
7
Pacific 8
14 10 9
12
12
14
14
18–14 Atlantic
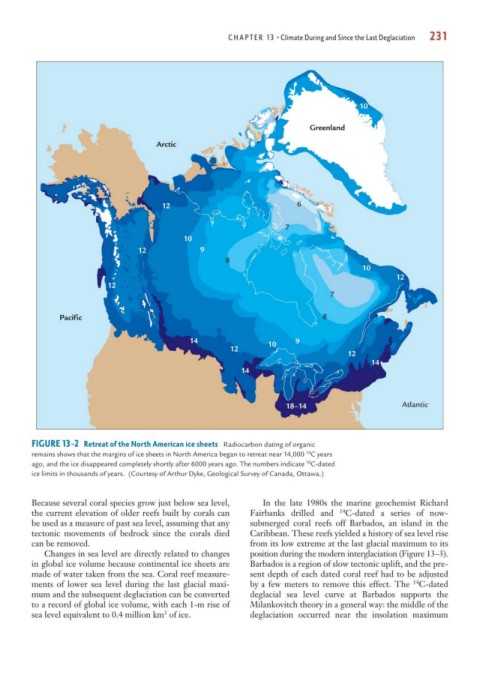
FIGURE 13-2 Retreat of the North American ice sheets Radiocarbon dating of organic
14
remains shows that the margins of ice sheets in North America began to retreat near 14,000 C years
14
ago, and the ice disappeared completely shortly after 6000 years ago. The numbers indicate C-dated
ice limits in thousands of years. (Courtesy of Arthur Dyke, Geological Survey of Canada, Ottawa.)
Because several coral species grow just below sea level, In the late 1980s the marine geochemist Richard
the current elevation of older reefs built by corals can Fairbanks drilled and 14 C-dated a series of now-
be used as a measure of past sea level, assuming that any submerged coral reefs off Barbados, an island in the
tectonic movements of bedrock since the corals died Caribbean. These reefs yielded a history of sea level rise
can be removed. from its low extreme at the last glacial maximum to its
Changes in sea level are directly related to changes position during the modern interglaciation (Figure 13–3).
in global ice volume because continental ice sheets are Barbados is a region of slow tectonic uplift, and the pre-
made of water taken from the sea. Coral reef measure- sent depth of each dated coral reef had to be adjusted
ments of lower sea level during the last glacial maxi- by a few meters to remove this effect. The C-dated
14
mum and the subsequent deglaciation can be converted deglacial sea level curve at Barbados supports the
to a record of global ice volume, with each 1-m rise of Milankovitch theory in a general way: the middle of the
sea level equivalent to 0.4 million km of ice. deglaciation occurred near the insolation maximum
3