
Page 258 - Earth's Climate Past and Future
P. 258
234 PART IV • Deglacial Climate Changes
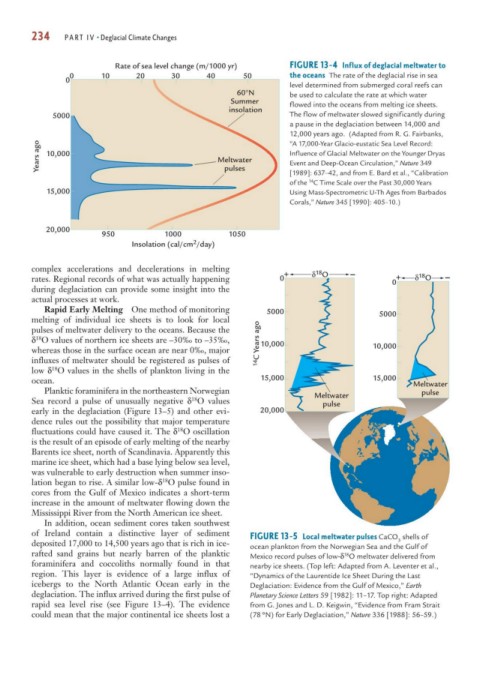
Rate of sea level change (m/1000 yr) FIGURE 13-4 Influx of deglacial meltwater to
0 10 20 30 40 50 the oceans The rate of the deglacial rise in sea
0
level determined from submerged coral reefs can
60°N be used to calculate the rate at which water
Summer flowed into the oceans from melting ice sheets.
insolation
5000 The flow of meltwater slowed significantly during
a pause in the deglaciation between 14,000 and
12,000 years ago. (Adapted from R. G. Fairbanks,
“A 17,000-Year Glacio-eustatic Sea Level Record:
Years ago 10,000 Meltwater Influence of Glacial Meltwater on the Younger Dryas
Event and Deep-Ocean Circulation,” Nature 349
pulses
[1989]: 637–42, and from E. Bard et al., “Calibration
14
of the C Time Scale over the Past 30,000 Years
15,000 Using Mass-Spectrometric U-Th Ages from Barbados
Corals,” Nature 345 [1990]: 405–10.)
20,000
950 1000 1050
2
Insolation (cal/cm /day)
complex accelerations and decelerations in melting + 18 _ _
18
rates. Regional records of what was actually happening 0 δ O 0 + δ O
during deglaciation can provide some insight into the
actual processes at work.
Rapid Early Melting One method of monitoring 5000
melting of individual ice sheets is to look for local 5000
pulses of meltwater delivery to the oceans. Because the
18
δ O values of northern ice sheets are –30‰ to –35‰, 14 C Years ago 10,000
whereas those in the surface ocean are near 0‰, major 10,000
influxes of meltwater should be registered as pulses of
18
low δ O values in the shells of plankton living in the
ocean. 15,000 15,000 Meltwater
Planktic foraminifera in the northeastern Norwegian pulse
18
Sea record a pulse of unusually negative δ O values Meltwater
pulse
early in the deglaciation (Figure 13–5) and other evi- 20,000
dence rules out the possibility that major temperature
18
fluctuations could have caused it. The δ O oscillation
is the result of an episode of early melting of the nearby
Barents ice sheet, north of Scandinavia. Apparently this
marine ice sheet, which had a base lying below sea level,
was vulnerable to early destruction when summer inso-
18
lation began to rise. A similar low-δ O pulse found in
cores from the Gulf of Mexico indicates a short-term
increase in the amount of meltwater flowing down the
Mississippi River from the North American ice sheet.
In addition, ocean sediment cores taken southwest
of Ireland contain a distinctive layer of sediment FIGURE 13-5 Local meltwater pulses CaCO shells of
3
deposited 17,000 to 14,500 years ago that is rich in ice- ocean plankton from the Norwegian Sea and the Gulf of
rafted sand grains but nearly barren of the planktic Mexico record pulses of low-δ O meltwater delivered from
18
foraminifera and coccoliths normally found in that nearby ice sheets. (Top left: Adapted from A. Leventer et al.,
region. This layer is evidence of a large influx of “Dynamics of the Laurentide Ice Sheet During the Last
icebergs to the North Atlantic Ocean early in the Deglaciation: Evidence from the Gulf of Mexico,” Earth
deglaciation. The influx arrived during the first pulse of Planetary Science Letters 59 [1982]: 11–17. Top right: Adapted
rapid sea level rise (see Figure 13–4). The evidence from G. Jones and L. D. Keigwin, “Evidence from Fram Strait
could mean that the major continental ice sheets lost a (78°N) for Early Deglaciation,” Nature 336 [1988]: 56–59.)