
Page 263 - Earth's Climate Past and Future
P. 263
CHAPTER 13 • Climate During and Since the Last Deglaciation 239
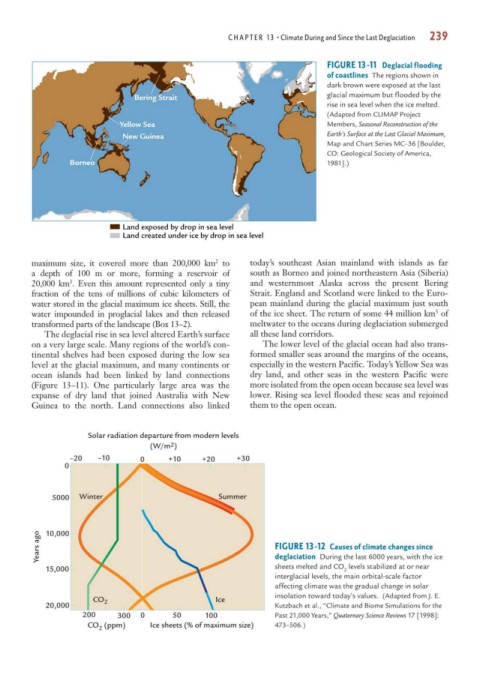
FIGURE 13-11 Deglacial flooding
of coastlines The regions shown in
dark brown were exposed at the last
Bering Strait glacial maximum but flooded by the
rise in sea level when the ice melted.
(Adapted from CLIMAP Project
Yellow Sea Members, Seasonal Reconstruction of the
New Guinea Earth’s Surface at the Last Glacial Maximum,
Map and Chart Series MC–36 [Boulder,
CO: Geological Society of America,
Borneo 1981].)
Land exposed by drop in sea level
Land created under ice by drop in sea level
2
maximum size, it covered more than 200,000 km to today’s southeast Asian mainland with islands as far
a depth of 100 m or more, forming a reservoir of south as Borneo and joined northeastern Asia (Siberia)
3
20,000 km . Even this amount represented only a tiny and westernmost Alaska across the present Bering
fraction of the tens of millions of cubic kilometers of Strait. England and Scotland were linked to the Euro-
water stored in the glacial maximum ice sheets. Still, the pean mainland during the glacial maximum just south
3
water impounded in proglacial lakes and then released of the ice sheet. The return of some 44 million km of
transformed parts of the landscape (Box 13–2). meltwater to the oceans during deglaciation submerged
The deglacial rise in sea level altered Earth’s surface all these land corridors.
on a very large scale. Many regions of the world’s con- The lower level of the glacial ocean had also trans-
tinental shelves had been exposed during the low sea formed smaller seas around the margins of the oceans,
level at the glacial maximum, and many continents or especially in the western Pacific. Today’s Yellow Sea was
ocean islands had been linked by land connections dry land, and other seas in the western Pacific were
(Figure 13–11). One particularly large area was the more isolated from the open ocean because sea level was
expanse of dry land that joined Australia with New lower. Rising sea level flooded these seas and rejoined
Guinea to the north. Land connections also linked them to the open ocean.
Solar radiation departure from modern levels
2
(W/m )
–20 –10 0 +10 +20 +30
0
5000 Winter Summer
Years ago 10,000 FIGURE 13-12 Causes of climate changes since
deglaciation During the last 6000 years, with the ice
15,000 sheets melted and CO levels stabilized at or near
2
interglacial levels, the main orbital-scale factor
affecting climate was the gradual change in solar
insolation toward today’s values. (Adapted from J. E.
CO 2 Ice
20,000 Kutzbach et al., “Climate and Biome Simulations for the
200 300 0 50 100 Past 21,000 Years,” Quaternary Science Reviews 17 [1998]:
CO (ppm) Ice sheets (% of maximum size) 473–506.)
2