Page 268 - Earth's Climate Past and Future
P. 268

244     PART IV • Deglacial Climate Changes


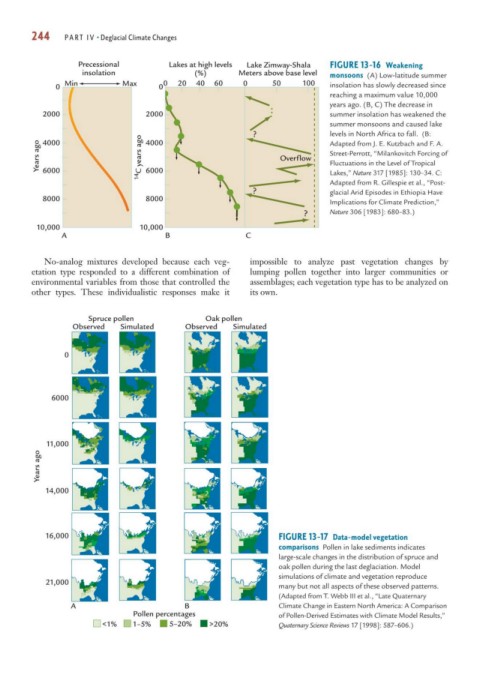
                   Precessional          Lakes at high levels  Lake Zimway-Shala  FIGURE 13-16 Weakening
                    insolation                 (%)       Meters above base level  monsoons (A) Low-latitude summer
                Min           Max      0   20  40  60     0      50     100
              0                       0                                        insolation has slowly decreased since
                                                                               reaching a maximum value 10,000
                                                                               years ago. (B, C) The decrease in
           2000                    2000                                        summer insolation has weakened the
                                                                               summer monsoons and caused lake
                                                             ?                 levels in North Africa to fall. (B:
                                   4000
          Years ago               14 C years ago                   Overflow    Street-Perrott, “Milankovitch Forcing of
           4000
                                                                               Adapted from J. E. Kutzbach and F. A.
                                                                               Fluctuations in the Level of Tropical
           6000
                                   6000
                                                                               Lakes,” Nature 317 [1985]: 130–34. C:
                                                                               Adapted from R. Gillespie et al., “Post-
                                                             ?                 glacial Arid Episodes in Ethiopia Have
           8000                    8000
                                                                               Implications for Climate Prediction,”
                                                                         ?     Nature 306 [1983]: 680–83.)
          10,000                  10,000
               A                        B                  C

           No-analog mixtures developed because each veg-   impossible to analyze past vegetation changes by
        etation type responded to a different combination of  lumping pollen together into larger communities or
        environmental variables from those that controlled the  assemblages; each vegetation type has to be analyzed on
        other types. These individualistic responses make it  its own.


                      Spruce pollen              Oak pollen
                  Observed   Simulated       Observed   Simulated


                0


             6000


            11,000
          Years ago


            14,000


            16,000                                                 FIGURE 13-17 Data-model vegetation
                                                                   comparisons Pollen in lake sediments indicates
                                                                   large-scale changes in the distribution of spruce and
                                                                   oak pollen during the last deglaciation. Model
                                                                   simulations of climate and vegetation reproduce
            21,000
                                                                   many but not all aspects of these observed patterns.
                                                                   (Adapted from T. Webb III et al., “Late Quaternary
                  A                          B                     Climate Change in Eastern North America: A Comparison
                                Pollen percentages                 of Pollen-Derived Estimates with Climate Model Results,”
                         <1%    1–5%     5–20%    >20%             Quaternary Science Reviews 17 [1998]: 587–606.)
   263   264   265   266   267   268   269   270   271   272   273