
Page 269 - Earth's Climate Past and Future
P. 269
CHAPTER 13 • Climate During and Since the Last Deglaciation 245
The distributions of spruce and oak pollen simulated much of the year, this additional warming extended
by climate models are also shown in Figure 13–17 for through most of the year and affected broad areas of
comparison with the observed distributions. Both sets of northern Canada and Asia (Figure 13–18B). The net
maps show the same large-scale northward relocation of
spruce, and they agree on the existence of a mid-
deglacial interval when spruce became rare throughout
eastern North America. Both sets of maps also show a
similar northward expansion of oak, but the model sim-
ulates more oak in the southeast during deglaciation
than the pollen data show, a mismatch similar to those
noted for the glacial maximum (Chapter 12).
Peak Warmth Once CO values had risen to full
2
interglacial levels and only remnants of the ice sheets
were left, summer insolation values became the main
control on climate responses, particularly for vegeta-
tion. The high summer insolation values that had trig-
gered ice melting remained greater than their current
levels but had begun the decrease toward modern levels
(see Figure 13–12). As a result, the warmest tempera- A Orbital insolation warming 1–2°C
tures of the last several thousand years were registered 2–3°C
immediately after the regional chilling effect of the ice >3°C
sheets was removed, but before the renewed cooling
effect caused by falling insolation levels. Some climate
scientists refer to this warmer-than-modern interval as
the hypsithermal, but the time of greatest warmth actu-
ally varies widely from region to region, depending on
when the nearby ice melted and its regional cooling
effect was removed.
With summer insolation values 6000 years ago still
5% higher than those today, the northern limit of
boreal (spruce and larch) forest in Siberia and west-
central Canada had moved as much as 300 km north
of its modern position, narrowing the fringe of tundra
bordering the Arctic Ocean. This expansion of forest B Vegetation feedback warming
beyond its modern limits confirms that summer tem-
peratures on the northern continents were warmer than 4 Orbital
they are today. Winter insolation values lower than 3
those today may have produced cooler winter tempera- 2 Orbital
tures, but the northern limit of boreal forest is mainly Temperature change (°C)
sensitive to temperature during the summer growing 1 Vegetation Vegetation
season. 0
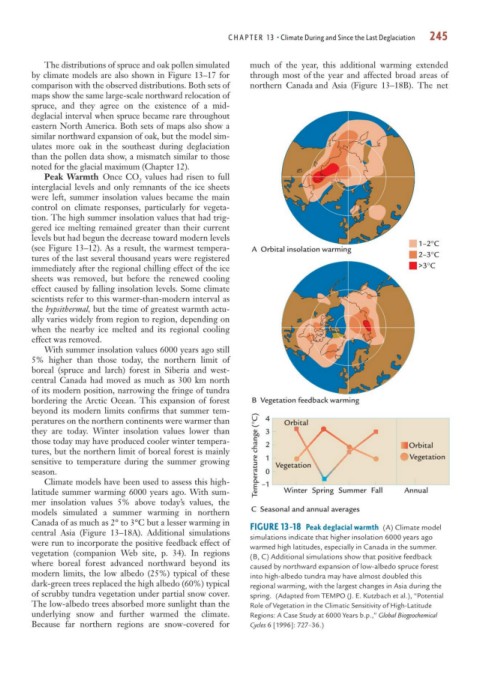
Climate models have been used to assess this high- –1
latitude summer warming 6000 years ago. With sum- Winter Spring Summer Fall Annual
mer insolation values 5% above today’s values, the
models simulated a summer warming in northern C Seasonal and annual averages
Canada of as much as 2° to 3°C but a lesser warming in FIGURE 13-18 Peak deglacial warmth (A) Climate model
central Asia (Figure 13–18A). Additional simulations simulations indicate that higher insolation 6000 years ago
were run to incorporate the positive feedback effect of warmed high latitudes, especially in Canada in the summer.
vegetation (companion Web site, p. 34). In regions (B, C) Additional simulations show that positive feedback
where boreal forest advanced northward beyond its caused by northward expansion of low-albedo spruce forest
modern limits, the low albedo (25%) typical of these into high-albedo tundra may have almost doubled this
dark-green trees replaced the high albedo (60%) typical regional warming, with the largest changes in Asia during the
of scrubby tundra vegetation under partial snow cover. spring. (Adapted from TEMPO (J. E. Kutzbach et al.), “Potential
The low-albedo trees absorbed more sunlight than the Role of Vegetation in the Climatic Sensitivity of High-Latitude
underlying snow and further warmed the climate. Regions: A Case Study at 6000 Years b.p.,” Global Biogeochemical
Because far northern regions are snow-covered for Cycles 6 [1996]: 727–36.)