
Page 283 - Earth's Climate Past and Future
P. 283
CHAPTER 14 • Millennial Oscillations of Climate 259
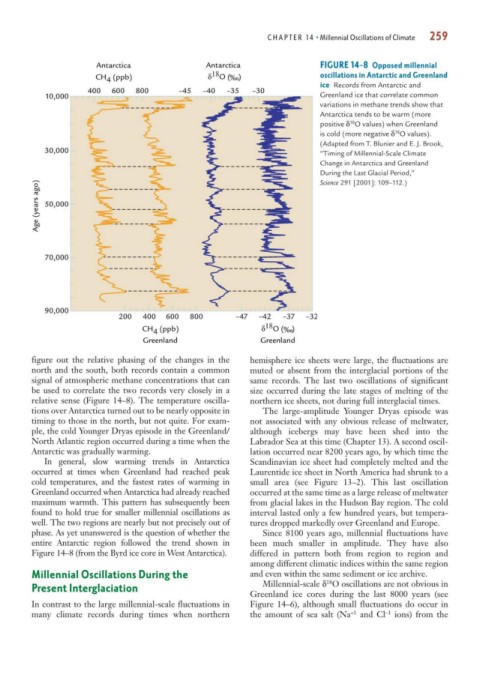
Antarctica Antarctica FIGURE 14-8 Opposed millennial
CH (ppb) δ 18 O ( ) oscillations in Antarctic and Greenland
4
ice Records from Antarctic and
400 600 800 –45 –40 –35 –30
10,000 Greenland ice that correlate common
variations in methane trends show that
Antarctica tends to be warm (more
18
positive δ O values) when Greenland
18
is cold (more negative δ O values).
(Adapted from T. Blunier and E. J. Brook,
30,000 “Timing of Millennial-Scale Climate
Change in Antarctica and Greenland
During the Last Glacial Period,”
Age (years ago) 50,000
Science 291 [2001]: 109–112.)
70,000
90,000
200 400 600 800 –47 –42 –37 –32
CH (ppb) δ 18 O ( )
4
Greenland Greenland
figure out the relative phasing of the changes in the hemisphere ice sheets were large, the fluctuations are
north and the south, both records contain a common muted or absent from the interglacial portions of the
signal of atmospheric methane concentrations that can same records. The last two oscillations of significant
be used to correlate the two records very closely in a size occurred during the late stages of melting of the
relative sense (Figure 14–8). The temperature oscilla- northern ice sheets, not during full interglacial times.
tions over Antarctica turned out to be nearly opposite in The large-amplitude Younger Dryas episode was
timing to those in the north, but not quite. For exam- not associated with any obvious release of meltwater,
ple, the cold Younger Dryas episode in the Greenland/ although icebergs may have been shed into the
North Atlantic region occurred during a time when the Labrador Sea at this time (Chapter 13). A second oscil-
Antarctic was gradually warming. lation occurred near 8200 years ago, by which time the
In general, slow warming trends in Antarctica Scandinavian ice sheet had completely melted and the
occurred at times when Greenland had reached peak Laurentide ice sheet in North America had shrunk to a
cold temperatures, and the fastest rates of warming in small area (see Figure 13–2). This last oscillation
Greenland occurred when Antarctica had already reached occurred at the same time as a large release of meltwater
maximum warmth. This pattern has subsequently been from glacial lakes in the Hudson Bay region. The cold
found to hold true for smaller millennial oscillations as interval lasted only a few hundred years, but tempera-
well. The two regions are nearly but not precisely out of tures dropped markedly over Greenland and Europe.
phase. As yet unanswered is the question of whether the Since 8100 years ago, millennial fluctuations have
entire Antarctic region followed the trend shown in been much smaller in amplitude. They have also
Figure 14–8 (from the Byrd ice core in West Antarctica). differed in pattern both from region to region and
among different climatic indices within the same region
Millennial Oscillations During the and even within the same sediment or ice archive.
18
Millennial-scale δ O oscillations are not obvious in
Present Interglaciation
Greenland ice cores during the last 8000 years (see
In contrast to the large millennial-scale fluctuations in Figure 14–6), although small fluctuations do occur in
many climate records during times when northern the amount of sea salt (Na +1 and Cl –1 ions) from the