
Page 288 - Earth's Climate Past and Future
P. 288
264 PART IV • Deglacial Climate Changes
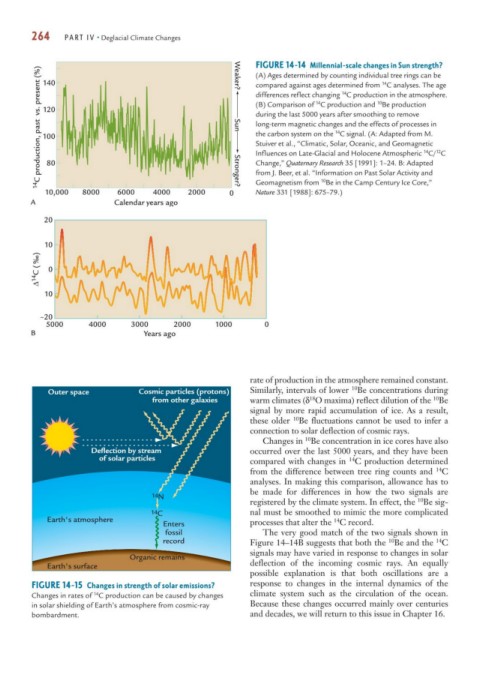
FIGURE 14-14 Millennial-scale changes in Sun strength?
14 C production, past vs. present (%) 120 Weaker? Sun Stronger? (B) Comparison of C production and Be production 14 12
(A) Ages determined by counting individual tree rings can be
140
14
compared against ages determined from C analyses. The age
14
differences reflect changing C production in the atmosphere.
10
14
during the last 5000 years after smoothing to remove
long-term magnetic changes and the effects of processes in
14
the carbon system on the C signal. (A: Adapted from M.
100
Stuiver et al., “Climatic, Solar, Oceanic, and Geomagnetic
Influences on Late-Glacial and Holocene Atmospheric C/ C
80
from J. Beer, et al. “Information on Past Solar Activity and
10
Geomagnetism from Be in the Camp Century Ice Core,”
Nature 331 [1988]: 675–79.)
10,000 8000 6000 4000 2000 0 Change,” Quaternary Research 35 [1991]: 1–24. B: Adapted
A Calendar years ago
20
10
Δ 14 C ( ) 0
10
–20
5000 4000 3000 2000 1000 0
B Years ago
rate of production in the atmosphere remained constant.
10
Outer space Cosmic particles (protons) Similarly, intervals of lower Be concentrations during
18
from other galaxies warm climates (δ O maxima) reflect dilution of the Be
10
signal by more rapid accumulation of ice. As a result,
these older Be fluctuations cannot be used to infer a
10
connection to solar deflection of cosmic rays.
Changes in Be concentration in ice cores have also
10
Deflection by stream occurred over the last 5000 years, and they have been
of solar particles compared with changes in C production determined
14
from the difference between tree ring counts and C
14
analyses. In making this comparison, allowance has to
be made for differences in how the two signals are
14 N
10
registered by the climate system. In effect, the Be sig-
14 C nal must be smoothed to mimic the more complicated
Earth's atmosphere 14
Enters processes that alter the C record.
fossil The very good match of the two signals shown in
record Figure 14–14B suggests that both the Be and the C
10
14
signals may have varied in response to changes in solar
Organic remains
Earth's surface deflection of the incoming cosmic rays. An equally
possible explanation is that both oscillations are a
FIGURE 14-15 Changes in strength of solar emissions? response to changes in the internal dynamics of the
14
Changes in rates of C production can be caused by changes climate system such as the circulation of the ocean.
in solar shielding of Earth’s atmosphere from cosmic-ray Because these changes occurred mainly over centuries
bombardment. and decades, we will return to this issue in Chapter 16.