
Page 328 - Earth's Climate Past and Future
P. 328
304 PART V • Historical and Future Climate Change
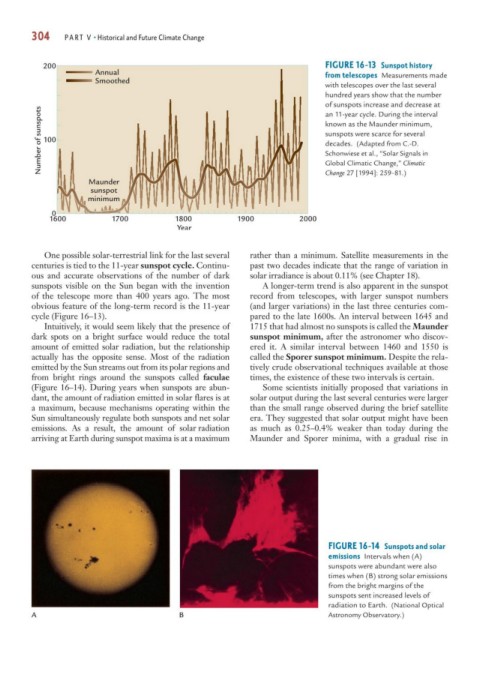
200 FIGURE 16-13 Sunspot history
Annual from telescopes Measurements made
Smoothed
with telescopes over the last several
hundred years show that the number
of sunspots increase and decrease at
Number of sunspots 100 known as the Maunder minimum,
an 11-year cycle. During the interval
sunspots were scarce for several
decades. (Adapted from C.-D.
Schonwiese et al., “Solar Signals in
Change 27 [1994]: 259–81.)
Maunder Global Climatic Change,” Climatic
sunspot
minimum
0
1600 1700 1800 1900 2000
Year
One possible solar-terrestrial link for the last several rather than a minimum. Satellite measurements in the
centuries is tied to the 11-year sunspot cycle. Continu- past two decades indicate that the range of variation in
ous and accurate observations of the number of dark solar irradiance is about 0.11% (see Chapter 18).
sunspots visible on the Sun began with the invention A longer-term trend is also apparent in the sunspot
of the telescope more than 400 years ago. The most record from telescopes, with larger sunspot numbers
obvious feature of the long-term record is the 11-year (and larger variations) in the last three centuries com-
cycle (Figure 16–13). pared to the late 1600s. An interval between 1645 and
Intuitively, it would seem likely that the presence of 1715 that had almost no sunspots is called the Maunder
dark spots on a bright surface would reduce the total sunspot minimum, after the astronomer who discov-
amount of emitted solar radiation, but the relationship ered it. A similar interval between 1460 and 1550 is
actually has the opposite sense. Most of the radiation called the Sporer sunspot minimum. Despite the rela-
emitted by the Sun streams out from its polar regions and tively crude observational techniques available at those
from bright rings around the sunspots called faculae times, the existence of these two intervals is certain.
(Figure 16–14). During years when sunspots are abun- Some scientists initially proposed that variations in
dant, the amount of radiation emitted in solar flares is at solar output during the last several centuries were larger
a maximum, because mechanisms operating within the than the small range observed during the brief satellite
Sun simultaneously regulate both sunspots and net solar era. They suggested that solar output might have been
emissions. As a result, the amount of solar radiation as much as 0.25–0.4% weaker than today during the
arriving at Earth during sunspot maxima is at a maximum Maunder and Sporer minima, with a gradual rise in
FIGURE 16-14 Sunspots and solar
emissions Intervals when (A)
sunspots were abundant were also
times when (B) strong solar emissions
from the bright margins of the
sunspots sent increased levels of
radiation to Earth. (National Optical
A B Astronomy Observatory.)