
Page 327 - Earth's Climate Past and Future
P. 327
CHAPTER 16 • Climate Changes During the Last 1000 Years 303
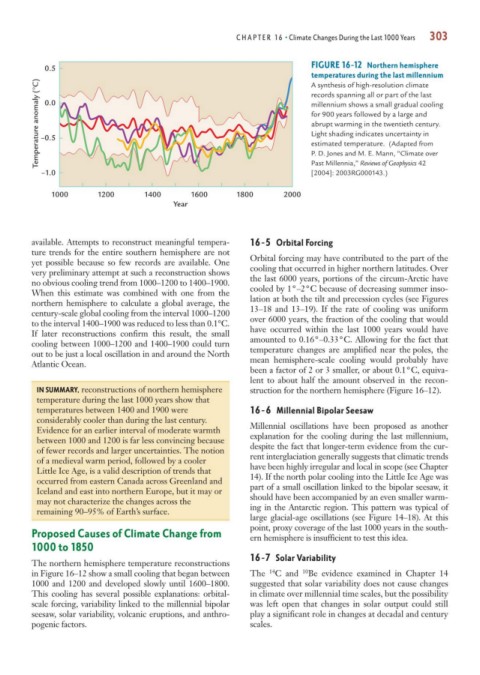
FIGURE 16-12 Northern hemisphere
0.5
temperatures during the last millennium
Temperature anomaly (°C) –0.5 millennium shows a small gradual cooling
A synthesis of high-resolution climate
records spanning all or part of the last
0.0
for 900 years followed by a large and
abrupt warming in the twentieth century.
Light shading indicates uncertainty in
estimated temperature. (Adapted from
Past Millennia,” Reviews of Geophysics 42
–1.0 P. D. Jones and M. E. Mann, “Climate over
[2004]: 2003RG000143.)
1000 1200 1400 1600 1800 2000
Year
available. Attempts to reconstruct meaningful tempera- 16-5 Orbital Forcing
ture trends for the entire southern hemisphere are not Orbital forcing may have contributed to the part of the
yet possible because so few records are available. One cooling that occurred in higher northern latitudes. Over
very preliminary attempt at such a reconstruction shows the last 6000 years, portions of the circum-Arctic have
no obvious cooling trend from 1000–1200 to 1400–1900. cooled by 1°–2°C because of decreasing summer inso-
When this estimate was combined with one from the lation at both the tilt and precession cycles (see Figures
northern hemisphere to calculate a global average, the 13–18 and 13–19). If the rate of cooling was uniform
century-scale global cooling from the interval 1000–1200 over 6000 years, the fraction of the cooling that would
to the interval 1400–1900 was reduced to less than 0.1°C. have occurred within the last 1000 years would have
If later reconstructions confirm this result, the small amounted to 0.16°–0.33°C. Allowing for the fact that
cooling between 1000–1200 and 1400–1900 could turn temperature changes are amplified near the poles, the
out to be just a local oscillation in and around the North mean hemisphere-scale cooling would probably have
Atlantic Ocean.
been a factor of 2 or 3 smaller, or about 0.1°C, equiva-
lent to about half the amount observed in the recon-
IN SUMMARY, reconstructions of northern hemisphere struction for the northern hemisphere (Figure 16–12).
temperature during the last 1000 years show that
temperatures between 1400 and 1900 were 16-6 Millennial Bipolar Seesaw
considerably cooler than during the last century. Millennial oscillations have been proposed as another
Evidence for an earlier interval of moderate warmth explanation for the cooling during the last millennium,
between 1000 and 1200 is far less convincing because despite the fact that longer-term evidence from the cur-
of fewer records and larger uncertainties. The notion rent interglaciation generally suggests that climatic trends
of a medieval warm period, followed by a cooler have been highly irregular and local in scope (see Chapter
Little Ice Age, is a valid description of trends that 14). If the north polar cooling into the Little Ice Age was
occurred from eastern Canada across Greenland and part of a small oscillation linked to the bipolar seesaw, it
Iceland and east into northern Europe, but it may or should have been accompanied by an even smaller warm-
may not characterize the changes across the ing in the Antarctic region. This pattern was typical of
remaining 90–95% of Earth’s surface.
large glacial-age oscillations (see Figure 14–18). At this
point, proxy coverage of the last 1000 years in the south-
Proposed Causes of Climate Change from ern hemisphere is insufficient to test this idea.
1000 to 1850
16-7 Solar Variability
The northern hemisphere temperature reconstructions
10
14
in Figure 16–12 show a small cooling that began between The C and Be evidence examined in Chapter 14
1000 and 1200 and developed slowly until 1600–1800. suggested that solar variability does not cause changes
This cooling has several possible explanations: orbital- in climate over millennial time scales, but the possibility
scale forcing, variability linked to the millennial bipolar was left open that changes in solar output could still
seesaw, solar variability, volcanic eruptions, and anthro- play a significant role in changes at decadal and century
pogenic factors. scales.