
Page 326 - Earth's Climate Past and Future
P. 326
302 PART V • Historical and Future Climate Change
V S
S
M
None
1540 1560 1580 1600 1620 1640 1660 1680 1700 1720 1740
1760 1780 1800 1820 1840 1860 1880 1900 1920 1940 1960 1980
Year
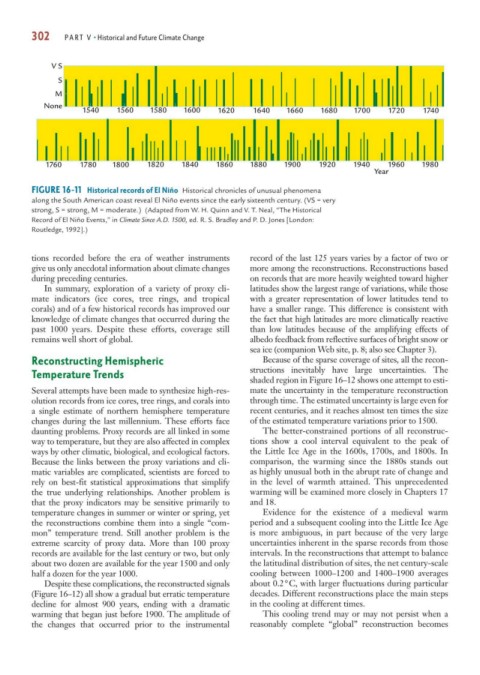
FIGURE 16-11 Historical records of El Niño Historical chronicles of unusual phenomena
along the South American coast reveal El Niño events since the early sixteenth century. (VS = very
strong, S = strong, M = moderate.) (Adapted from W. H. Quinn and V. T. Neal, “The Historical
Record of El Niño Events,” in Climate Since A.D. 1500, ed. R. S. Bradley and P. D. Jones [London:
Routledge, 1992].)
tions recorded before the era of weather instruments record of the last 125 years varies by a factor of two or
give us only anecdotal information about climate changes more among the reconstructions. Reconstructions based
during preceding centuries. on records that are more heavily weighted toward higher
In summary, exploration of a variety of proxy cli- latitudes show the largest range of variations, while those
mate indicators (ice cores, tree rings, and tropical with a greater representation of lower latitudes tend to
corals) and of a few historical records has improved our have a smaller range. This difference is consistent with
knowledge of climate changes that occurred during the the fact that high latitudes are more climatically reactive
past 1000 years. Despite these efforts, coverage still than low latitudes because of the amplifying effects of
remains well short of global. albedo feedback from reflective surfaces of bright snow or
sea ice (companion Web site, p. 8; also see Chapter 3).
Reconstructing Hemispheric Because of the sparse coverage of sites, all the recon-
structions inevitably have large uncertainties. The
Temperature Trends
shaded region in Figure 16–12 shows one attempt to esti-
Several attempts have been made to synthesize high-res- mate the uncertainty in the temperature reconstruction
olution records from ice cores, tree rings, and corals into through time. The estimated uncertainty is large even for
a single estimate of northern hemisphere temperature recent centuries, and it reaches almost ten times the size
changes during the last millennium. These efforts face of the estimated temperature variations prior to 1500.
daunting problems. Proxy records are all linked in some The better-constrained portions of all reconstruc-
way to temperature, but they are also affected in complex tions show a cool interval equivalent to the peak of
ways by other climatic, biological, and ecological factors. the Little Ice Age in the 1600s, 1700s, and 1800s. In
Because the links between the proxy variations and cli- comparison, the warming since the 1880s stands out
matic variables are complicated, scientists are forced to as highly unusual both in the abrupt rate of change and
rely on best-fit statistical approximations that simplify in the level of warmth attained. This unprecedented
the true underlying relationships. Another problem is warming will be examined more closely in Chapters 17
that the proxy indicators may be sensitive primarily to and 18.
temperature changes in summer or winter or spring, yet Evidence for the existence of a medieval warm
the reconstructions combine them into a single “com- period and a subsequent cooling into the Little Ice Age
mon” temperature trend. Still another problem is the is more ambiguous, in part because of the very large
extreme scarcity of proxy data. More than 100 proxy uncertainties inherent in the sparse records from those
records are available for the last century or two, but only intervals. In the reconstructions that attempt to balance
about two dozen are available for the year 1500 and only the latitudinal distribution of sites, the net century-scale
half a dozen for the year 1000. cooling between 1000–1200 and 1400–1900 averages
Despite these complications, the reconstructed signals about 0.2°C, with larger fluctuations during particular
(Figure 16–12) all show a gradual but erratic temperature decades. Different reconstructions place the main steps
decline for almost 900 years, ending with a dramatic in the cooling at different times.
warming that began just before 1900. The amplitude of This cooling trend may or may not persist when a
the changes that occurred prior to the instrumental reasonably complete “global” reconstruction becomes