
Page 323 - Earth's Climate Past and Future
P. 323
CHAPTER 16 • Climate Changes During the Last 1000 Years 299
1600 1700 1800 1900 2000
0.5
SST (°C) (vs. 1961–1990) 0.0
–0.5
10 Sites
0
18
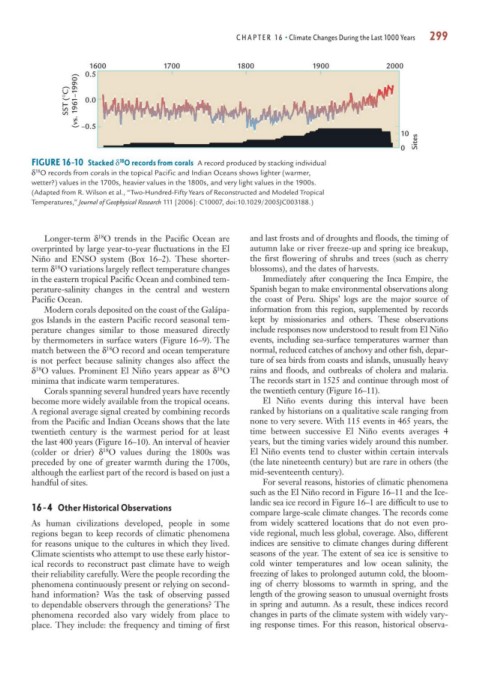
FIGURE 16-10 Stacked δ O records from corals A record produced by stacking individual
18
δ O records from corals in the topical Pacific and Indian Oceans shows lighter (warmer,
wetter?) values in the 1700s, heavier values in the 1800s, and very light values in the 1900s.
(Adapted from R. Wilson et al., “Two-Hundred-Fifty Years of Reconstructed and Modeled Tropical
Temperatures,” Journal of Geophysical Research 111 [2006]: C10007, doi:10.1029/2005JC003188.)
Longer-term δ O trends in the Pacific Ocean are and last frosts and of droughts and floods, the timing of
18
overprinted by large year-to-year fluctuations in the El autumn lake or river freeze-up and spring ice breakup,
Niño and ENSO system (Box 16–2). These shorter- the first flowering of shrubs and trees (such as cherry
18
term δ O variations largely reflect temperature changes blossoms), and the dates of harvests.
in the eastern tropical Pacific Ocean and combined tem- Immediately after conquering the Inca Empire, the
perature-salinity changes in the central and western Spanish began to make environmental observations along
Pacific Ocean. the coast of Peru. Ships’ logs are the major source of
Modern corals deposited on the coast of the Galápa- information from this region, supplemented by records
gos Islands in the eastern Pacific record seasonal tem- kept by missionaries and others. These observations
perature changes similar to those measured directly include responses now understood to result from El Niño
by thermometers in surface waters (Figure 16–9). The events, including sea-surface temperatures warmer than
match between the δ O record and ocean temperature normal, reduced catches of anchovy and other fish, depar-
18
is not perfect because salinity changes also affect the ture of sea birds from coasts and islands, unusually heavy
δ O values. Prominent El Niño years appear as δ O rains and floods, and outbreaks of cholera and malaria.
18
18
minima that indicate warm temperatures. The records start in 1525 and continue through most of
Corals spanning several hundred years have recently the twentieth century (Figure 16–11).
become more widely available from the tropical oceans. El Niño events during this interval have been
A regional average signal created by combining records ranked by historians on a qualitative scale ranging from
from the Pacific and Indian Oceans shows that the late none to very severe. With 115 events in 465 years, the
twentieth century is the warmest period for at least time between successive El Niño events averages 4
the last 400 years (Figure 16–10). An interval of heavier years, but the timing varies widely around this number.
(colder or drier) δ O values during the 1800s was El Niño events tend to cluster within certain intervals
18
preceded by one of greater warmth during the 1700s, (the late nineteenth century) but are rare in others (the
although the earliest part of the record is based on just a mid-seventeenth century).
handful of sites. For several reasons, histories of climatic phenomena
such as the El Niño record in Figure 16–11 and the Ice-
landic sea ice record in Figure 16–1 are difficult to use to
16-4 Other Historical Observations
compare large-scale climate changes. The records come
As human civilizations developed, people in some from widely scattered locations that do not even pro-
regions began to keep records of climatic phenomena vide regional, much less global, coverage. Also, different
for reasons unique to the cultures in which they lived. indices are sensitive to climate changes during different
Climate scientists who attempt to use these early histor- seasons of the year. The extent of sea ice is sensitive to
ical records to reconstruct past climate have to weigh cold winter temperatures and low ocean salinity, the
their reliability carefully. Were the people recording the freezing of lakes to prolonged autumn cold, the bloom-
phenomena continuously present or relying on second- ing of cherry blossoms to warmth in spring, and the
hand information? Was the task of observing passed length of the growing season to unusual overnight frosts
to dependable observers through the generations? The in spring and autumn. As a result, these indices record
phenomena recorded also vary widely from place to changes in parts of the climate system with widely vary-
place. They include: the frequency and timing of first ing response times. For this reason, historical observa-