
Page 318 - Earth's Climate Past and Future
P. 318
294 PART V • Historical and Future Climate Change
δ 18 O per mil –20 Dunde ice cap δ 18 O(‰) –10
–16
–18
–11
–12
Year
Dust amount 0 1000 2000
1000 1250 1500 1750 1980
A Year
Elevation (m) 5700 Quelccaya
5600
ice cap
5500
5400
5300
B 1976 ice core 1991 ice core
18
18
δ O(‰) δ O(‰)
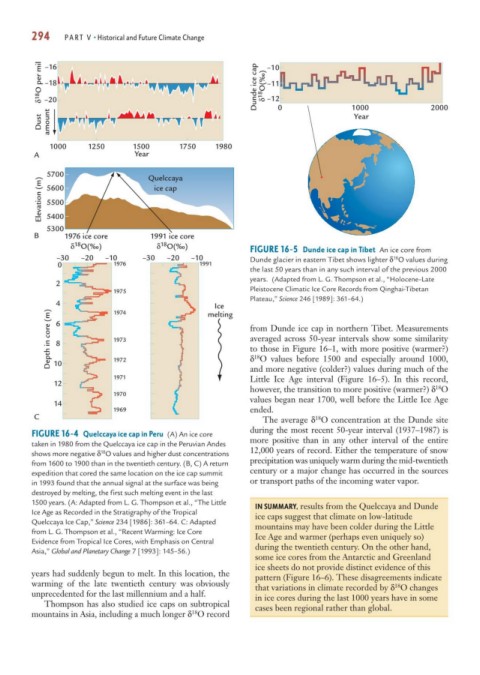
FIGURE 16-5 Dunde ice cap in Tibet An ice core from
–30 –20 –10 –30 –20 –10 Dunde glacier in eastern Tibet shows lighter δ O values during
18
0 1976 1991
the last 50 years than in any such interval of the previous 2000
years. (Adapted from L. G. Thompson et al., “Holocene–Late
2
1975 Pleistocene Climatic Ice Core Records from Qinghai-Tibetan
Plateau,” Science 246 [1989]: 361–64.)
4 1974 melting
Ice
Depth in core (m) 6 1973 from Dunde ice cap in northern Tibet. Measurements
averaged across 50-year intervals show some similarity
8
to those in Figure 16–1, with more positive (warmer?)
18
δ O values before 1500 and especially around 1000,
1972
10
1971 and more negative (colder?) values during much of the
Little Ice Age interval (Figure 16–5). In this record,
12
however, the transition to more positive (warmer?) δ O
18
1970
values began near 1700, well before the Little Ice Age
14
1969 ended.
C The average δ O concentration at the Dunde site
18
during the most recent 50-year interval (1937–1987) is
FIGURE 16-4 Quelccaya ice cap in Peru (A) An ice core
taken in 1980 from the Quelccaya ice cap in the Peruvian Andes more positive than in any other interval of the entire
18
shows more negative δ O values and higher dust concentrations 12,000 years of record. Either the temperature of snow
from 1600 to 1900 than in the twentieth century. (B, C) A return precipitation was uniquely warm during the mid-twentieth
expedition that cored the same location on the ice cap summit century or a major change has occurred in the sources
in 1993 found that the annual signal at the surface was being or transport paths of the incoming water vapor.
destroyed by melting, the first such melting event in the last
1500 years. (A: Adapted from L. G. Thompson et al., “The Little IN SUMMARY, results from the Quelccaya and Dunde
Ice Age as Recorded in the Stratigraphy of the Tropical ice caps suggest that climate on low-latitude
Quelccaya Ice Cap,” Science 234 [1986]: 361–64. C: Adapted mountains may have been colder during the Little
from L. G. Thompson et al., “Recent Warming: Ice Core Ice Age and warmer (perhaps even uniquely so)
Evidence from Tropical Ice Cores, with Emphasis on Central
Asia,” Global and Planetary Change 7 [1993]: 145–56.) during the twentieth century. On the other hand,
some ice cores from the Antarctic and Greenland
ice sheets do not provide distinct evidence of this
years had suddenly begun to melt. In this location, the pattern (Figure 16–6). These disagreements indicate
warming of the late twentieth century was obviously that variations in climate recorded by δ O changes
18
unprecedented for the last millennium and a half. in ice cores during the last 1000 years have in some
Thompson has also studied ice caps on subtropical cases been regional rather than global.
18
mountains in Asia, including a much longer δ O record