
Page 322 - Earth's Climate Past and Future
P. 322
298 PART V • Historical and Future Climate Change
Temperature anomaly (°C) 0 IN SUMMARY, tree rings, like ice cores, tell us that
+0.5
climate has varied from region to region over the
last several hundred years so that no one record fully
describes the trends in all areas. Viewed in their
entirety, tree ring signals tell us that climate varied
–0.5
regions even warming at times to levels comparable
500
1000
0
to those observed during part of the twentieth
Year 1500 2000 significantly within the Little Ice Age, in some
century. Many records show substantial and in some
cases unprecedented warmth in the 1900s.
16-3 Corals and Tropical Ocean Temperatures
Observations of climate changes at annual or decadal
resolution are not widely available from the oceans
because of slow deposition and mixing of sediments by
burrowing organisms. In recent years, climate scientists
have begun to exploit corals as climate archives, using
annual bands in their CaCO structures. Because most
3
corals grow in warm tropical or subtropical oceans, the
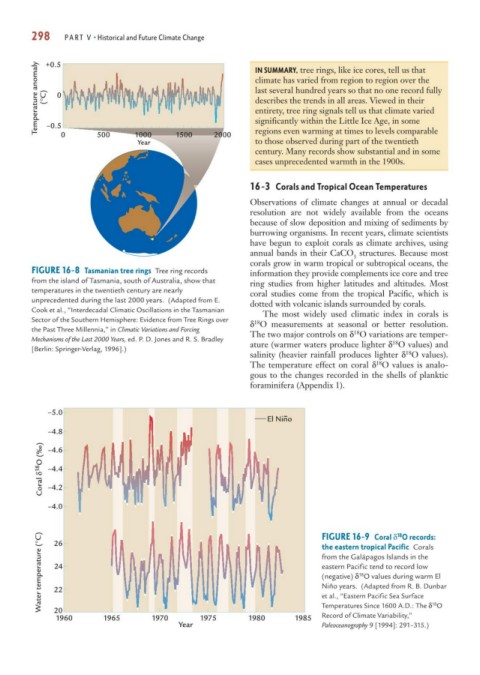
FIGURE 16-8 Tasmanian tree rings Tree ring records information they provide complements ice core and tree
from the island of Tasmania, south of Australia, show that ring studies from higher latitudes and altitudes. Most
temperatures in the twentieth century are nearly
coral studies come from the tropical Pacific, which is
unprecedented during the last 2000 years. (Adapted from E. dotted with volcanic islands surrounded by corals.
Cook et al., “Interdecadal Climatic Oscillations in the Tasmanian
The most widely used climatic index in corals is
Sector of the Southern Hemisphere: Evidence from Tree Rings over δ O measurements at seasonal or better resolution.
18
the Past Three Millennia,” in Climatic Variations and Forcing
The two major controls on δ O variations are temper-
18
Mechanisms of the Last 2000 Years, ed. P. D. Jones and R. S. Bradley 18
[Berlin: Springer-Verlag, 1996].) ature (warmer waters produce lighter δ O values) and
18
salinity (heavier rainfall produces lighter δ O values).
18
The temperature effect on coral δ O values is analo-
gous to the changes recorded in the shells of planktic
foraminifera (Appendix 1).
–5.0
El Nino
~
–4.8
Coral δ 18 O (‰) –4.4
–4.6
–4.2
–4.0 FIGURE 16-9 Coral δ O records:
Water temperature (°C) 26 the eastern tropical Pacific Corals
18
from the Galápagos Islands in the
eastern Pacific tend to record low
24
18
(negative) δ O values during warm El
Niño years. (Adapted from R. B. Dunbar
22
Temperatures Since 1600 A.D.: The δ O
20
Record of Climate Variability,”
1960 1965 1970 1975 1980 1985 et al., “Eastern Pacific Sea Surface 18
Year Paleoceanography 9 [1994]: 291–315.)