
Page 319 - Earth's Climate Past and Future
P. 319
CHAPTER 16 • Climate Changes During the Last 1000 Years 295
Greenland
–28
–30
Tibet
–10
–12
Ice core δ 18 O (‰ decade averages) –20 Peru A Estimated Arctic temperature change (°C) +2
–18
+1
0
–50 Antarctica –1
–2
B 1700 1800 1900 2000
–52
1200 1400 1600 1800 1.5
Year
18
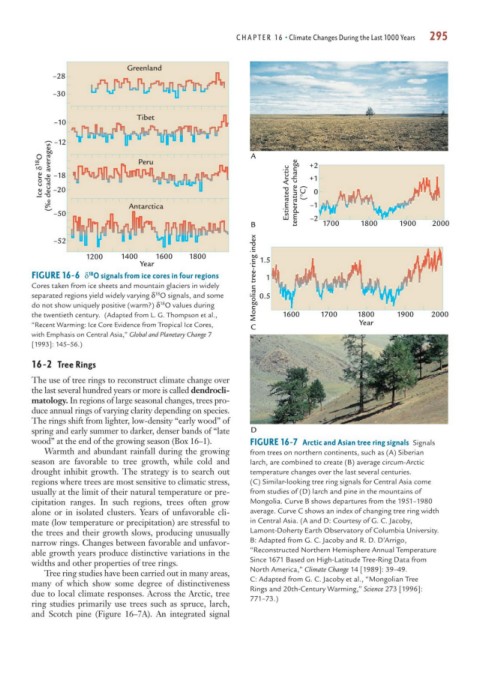
FIGURE 16-6 δ O signals from ice cores in four regions Mongolian tree-ring index 1
Cores taken from ice sheets and mountain glaciers in widely
18
separated regions yield widely varying δ O signals, and some 0.5
18
do not show uniquely positive (warm?) δ O values during
the twentieth century. (Adapted from L. G. Thompson et al., 1600 1700 1800 1900 2000
“Recent Warming: Ice Core Evidence from Tropical Ice Cores, C Year
with Emphasis on Central Asia,” Global and Planetary Change 7
[1993]: 145–56.)
16-2 Tree Rings
The use of tree rings to reconstruct climate change over
the last several hundred years or more is called dendrocli-
matology. In regions of large seasonal changes, trees pro-
duce annual rings of varying clarity depending on species.
The rings shift from lighter, low-density “early wood” of
spring and early summer to darker, denser bands of “late D
wood” at the end of the growing season (Box 16–1). FIGURE 16-7 Arctic and Asian tree ring signals Signals
Warmth and abundant rainfall during the growing from trees on northern continents, such as (A) Siberian
season are favorable to tree growth, while cold and larch, are combined to create (B) average circum-Arctic
drought inhibit growth. The strategy is to search out temperature changes over the last several centuries.
regions where trees are most sensitive to climatic stress, (C) Similar-looking tree ring signals for Central Asia come
usually at the limit of their natural temperature or pre- from studies of (D) larch and pine in the mountains of
cipitation ranges. In such regions, trees often grow Mongolia. Curve B shows departures from the 1951–1980
alone or in isolated clusters. Years of unfavorable cli- average. Curve C shows an index of changing tree ring width
mate (low temperature or precipitation) are stressful to in Central Asia. (A and D: Courtesy of G. C. Jacoby,
the trees and their growth slows, producing unusually Lamont-Doherty Earth Observatory of Columbia University.
narrow rings. Changes between favorable and unfavor- B: Adapted from G. C. Jacoby and R. D. D’Arrigo,
able growth years produce distinctive variations in the “Reconstructed Northern Hemisphere Annual Temperature
widths and other properties of tree rings. Since 1671 Based on High-Latitude Tree-Ring Data from
Tree ring studies have been carried out in many areas, North America,” Climate Change 14 [1989]: 39–49.
many of which show some degree of distinctiveness C: Adapted from G. C. Jacoby et al., “Mongolian Tree
due to local climate responses. Across the Arctic, tree Rings and 20th-Century Warming,” Science 273 [1996]:
771–73.)
ring studies primarily use trees such as spruce, larch,
and Scotch pine (Figure 16–7A). An integrated signal