
Page 334 - Earth's Climate Past and Future
P. 334
310 PART V • Historical and Future Climate Change
Reconstructing Changes in Sea Level later, these tide gauge records show not only short-term
changes caused by tides and storms but also longer-
One of the key sources of information on global climatic term histories of sea level change in the decades and
trends over the last 150 years is the average level of the centuries since their installation.
ocean. Reconstructing changes in sea level is greatly Deriving sea level trends from tide gauge records is
complicated by lingering effects of ice sheets that melted difficult. Some tide gauge records indicate rapid sea
thousands of years ago. In addition, several factors at level falls, but others show a slow sea level rise, and still
work today contribute to sea level change, including others indicate faster rises. At first, it doesn’t seem to
melting of land ice and changes in ocean temperature. make sense that completely different trends could occur
Beginning as early as the late eighteenth century, in different areas. The world ocean is one intercon-
seaport towns and cities installed tide gauges to mea- nected body of water, and it would seem that global sea
sure sea level changes caused by tides and large storms. level should rise or fall by the same amount everywhere,
The immediate goal of these efforts was to understand rather than rising in one place and falling in another
sea level changes well enough to build structures that over intervals of decades or centuries.
could protect communities from flooding. Tide gauges Some of these regional differences result from mod-
were most common in seaports in Europe and along the ern processes that vary regionally. Areas of active tectonic
East Coast of the United States, areas that had begun to uplift caused by mountain building or of active subsi-
industrialize early (Figure 17–1). Some 100 to 200 years dence caused by recently added sediment loads (such as
river deltas) have to be avoided in determining the actual
change in the level of the ocean. In addition, adjustments
must be made for human effects such as subsidence
caused by pumping of groundwater and impoundment of
rainfall runoff in reservoirs behind dams.
C 17-1 Fading Memories of Melted Ice Sheets
B By far the greatest problem in reconstructing past sea
levels is the fact that the bedrock of the land and under
the oceans still retains a memory of the ice sheets from
the most recent glaciation. Even though the last rem-
nants of the glacial maximum ice sheets finished melt-
ing near 10,000 years ago in Europe and 6000 years ago
in northern Canada, the rock in Earth’s upper mantle is
still in the process of adjusting to the previous load of
ice (Chapter 4). This bedrock “memory” causes differ-
A ent behaviors in today’s movements of Earth’s land and
seafloor surfaces. The types of long-term change in
relative sea level defined by tide gauges fall in three
geographic groups (Figure 17–2).
One group of tide gauges shows rapid drops in relative
sea level in recent centuries (Figure 17–3). These gauges
are located in regions that were once directly beneath the
ice sheets, such as the Hudson Bay region of Canada and
the Baltic Sea region of Scandinavia. Relative sea level is
now falling rapidly in these regions primarily because the
bedrock is still rebounding from the removal of the ice
B C sheet load thousands of years ago. A rise in bedrock means
a fall in relative (but not global) sea level.
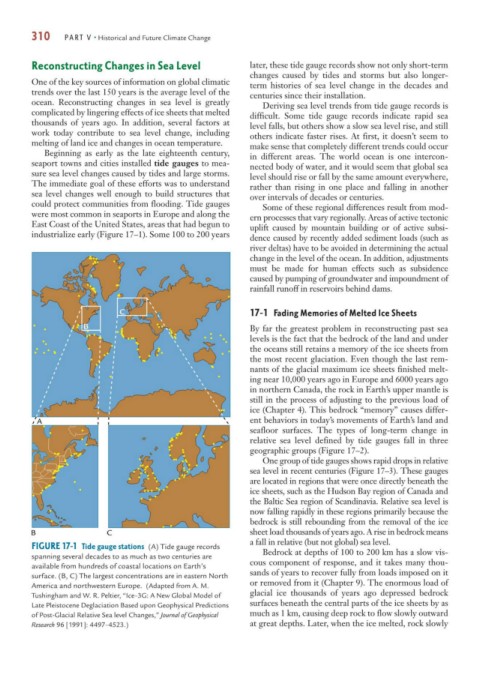
FIGURE 17-1 Tide gauge stations (A) Tide gauge records
spanning several decades to as much as two centuries are Bedrock at depths of 100 to 200 km has a slow vis-
available from hundreds of coastal locations on Earth’s cous component of response, and it takes many thou-
surface. (B, C) The largest concentrations are in eastern North sands of years to recover fully from loads imposed on it
or removed from it (Chapter 9). The enormous load of
America and northwestern Europe. (Adapted from A. M.
Tushingham and W. R. Peltier, “Ice–3G: A New Global Model of glacial ice thousands of years ago depressed bedrock
Late Pleistocene Deglaciation Based upon Geophysical Predictions surfaces beneath the central parts of the ice sheets by as
of Post-Glacial Relative Sea level Changes,” Journal of Geophysical much as 1 km, causing deep rock to flow slowly outward
Research 96 [1991]: 4497–4523.) at great depths. Later, when the ice melted, rock slowly