
Page 335 - Earth's Climate Past and Future
P. 335
CHAPTER 17 • Climatic Changes Since the 1800s 311
away from the coast of Hudson Bay (Figure 17–4B). The
14
highest-elevation ridge dates to 7000 C years ago, just
after the last ice melted from the area and ocean water
flooded back into the depression in Hudson Bay caused
by the ice. The stair-step series of beach ridges shows that
the land beneath the former ice sheet has been rising for
thousands of years, with the rates gradually slowing as the
bedrock memory of the ice sheet load has weakened.
Bedrock rising The second major group of tide gauge responses
Bedrock sinking shows a relatively fast rate of sea level rise. This group is
Ocean basins clustered in a halo pattern surrounding the former ice
sinking
sheets but extending well beyond the ice margins (see
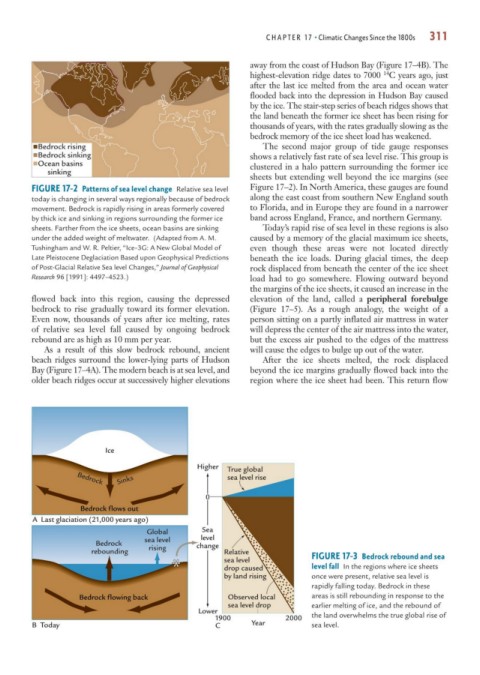
FIGURE 17-2 Patterns of sea level change Relative sea level Figure 17–2). In North America, these gauges are found
today is changing in several ways regionally because of bedrock along the east coast from southern New England south
movement. Bedrock is rapidly rising in areas formerly covered to Florida, and in Europe they are found in a narrower
by thick ice and sinking in regions surrounding the former ice band across England, France, and northern Germany.
sheets. Farther from the ice sheets, ocean basins are sinking Today’s rapid rise of sea level in these regions is also
under the added weight of meltwater. (Adapted from A. M. caused by a memory of the glacial maximum ice sheets,
Tushingham and W. R. Peltier, “Ice–3G: A New Global Model of even though these areas were not located directly
Late Pleistocene Deglaciation Based upon Geophysical Predictions beneath the ice loads. During glacial times, the deep
of Post-Glacial Relative Sea level Changes,” Journal of Geophysical rock displaced from beneath the center of the ice sheet
Research 96 [1991]: 4497–4523.) load had to go somewhere. Flowing outward beyond
the margins of the ice sheets, it caused an increase in the
flowed back into this region, causing the depressed elevation of the land, called a peripheral forebulge
bedrock to rise gradually toward its former elevation. (Figure 17–5). As a rough analogy, the weight of a
Even now, thousands of years after ice melting, rates person sitting on a partly inflated air mattress in water
of relative sea level fall caused by ongoing bedrock will depress the center of the air mattress into the water,
rebound are as high as 10 mm per year. but the excess air pushed to the edges of the mattress
As a result of this slow bedrock rebound, ancient will cause the edges to bulge up out of the water.
beach ridges surround the lower-lying parts of Hudson After the ice sheets melted, the rock displaced
Bay (Figure 17–4A). The modern beach is at sea level, and beyond the ice margins gradually flowed back into the
older beach ridges occur at successively higher elevations region where the ice sheet had been. This return flow
Ice
Higher True global
Sinks sea level rise
Bedrock
0
Bedrock flows out
A Last glaciation (21,000 years ago)
Global Sea
sea level level
Bedrock change
rebounding rising Relative
sea level FIGURE 17-3 Bedrock rebound and sea
drop caused level fall In the regions where ice sheets
by land rising once were present, relative sea level is
rapidly falling today. Bedrock in these
Bedrock flowing back Observed local areas is still rebounding in response to the
sea level drop earlier melting of ice, and the rebound of
Lower
1900 2000 the land overwhelms the true global rise of
B Today C Year sea level.