
Page 337 - Earth's Climate Past and Future
P. 337
CHAPTER 17 • Climatic Changes Since the 1800s 313
caused the peripheral forebulge to collapse and the land sinking of the ocean crust is still going on today
surface to sink (see Figure 17–5). The land in the region (because of the viscous memory effect), and it counter-
of the collapsing forebulges is still sinking, which adds acts a small part of the true rise of global sea level,
to the true rise of global sea level and produces a fast producing a slightly reduced rise in relative sea level in
rise of relative sea level in these regions. Dating of older regions far from the ice sheets.
(now submerged) beaches in these regions indicates that While the great glacial ice sheets are long gone, they
this pattern of unusually rapid rise in relative sea level are not forgotten, at least not by the bedrock and the
has persisted for thousands of years. shorelines. Bedrock memories of these shifting loads of
The third group of tide gauge responses comes from ice and water are the major obstacles to determining the
coastlines located far from the northern hemisphere ice true rate of global sea level rise during the past century.
sheets (Figure 17–6). Relative sea level in these regions Unfortunately, many of the longest and most reliable
is rising at rates slightly less than the global rate of sea tide gauge records happen to have been located in just
level rise. It might seem that regions located so far from those regions of Europe and North America where the
the glacial ice sheets should be free of memory effects lingering overprints from the ice sheets are largest.
from the ice, but they are not. The return of glacial Attempts to remove all these complications from the
meltwater to the oceans has added an extra load on the melted ice sheets indicate that sea level rose by about
bedrock beneath the ocean floor in these regions. 17 cm during the 1900s (Figure 17–7). Humans have
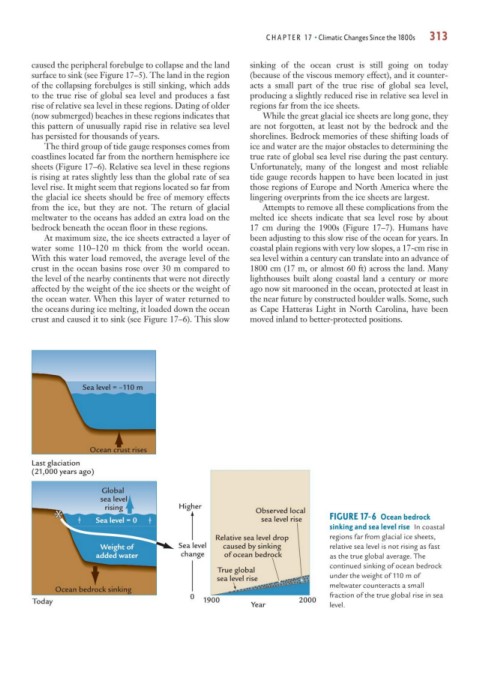
At maximum size, the ice sheets extracted a layer of been adjusting to this slow rise of the ocean for years. In
water some 110–120 m thick from the world ocean. coastal plain regions with very low slopes, a 17-cm rise in
With this water load removed, the average level of the sea level within a century can translate into an advance of
crust in the ocean basins rose over 30 m compared to 1800 cm (17 m, or almost 60 ft) across the land. Many
the level of the nearby continents that were not directly lighthouses built along coastal land a century or more
affected by the weight of the ice sheets or the weight of ago now sit marooned in the ocean, protected at least in
the ocean water. When this layer of water returned to the near future by constructed boulder walls. Some, such
the oceans during ice melting, it loaded down the ocean as Cape Hatteras Light in North Carolina, have been
crust and caused it to sink (see Figure 17–6). This slow moved inland to better-protected positions.
Sea level = –110 m
Ocean crust rises
Last glaciation
(21,000 years ago)
Global
sea level
rising Higher
Observed local
Sea level = 0 sea level rise FIGURE 17-6 Ocean bedrock
sinking and sea level rise In coastal
Relative sea level drop regions far from glacial ice sheets,
Weight of Sea level caused by sinking relative sea level is not rising as fast
added water change of ocean bedrock as the true global average. The
continued sinking of ocean bedrock
True global
sea level rise under the weight of 110 m of
meltwater counteracts a small
Ocean bedrock sinking
0 fraction of the true global rise in sea
Today 1900 Year 2000 level.