
Page 342 - Earth's Climate Past and Future
P. 342
318 PART V • Historical and Future Climate Change
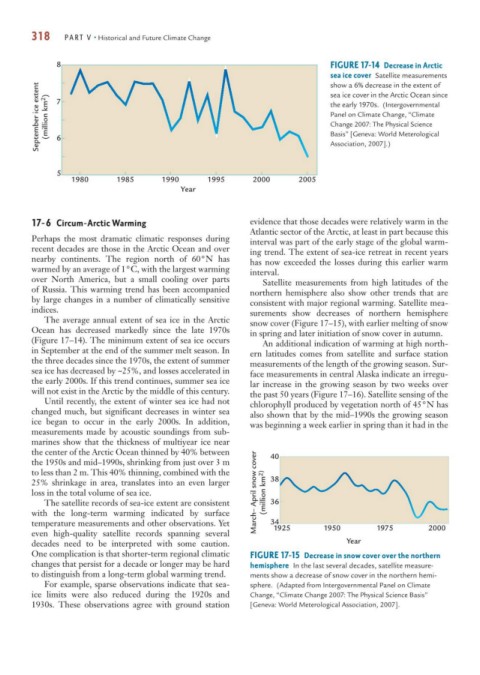
8 FIGURE 17-14 Decrease in Arctic
sea ice cover Satellite measurements
September ice extent (million km 2 ) 7 the early 1970s. (Intergovernmental
show a 6% decrease in the extent of
sea ice cover in the Arctic Ocean since
Panel on Climate Change, “Climate
Change 2007: The Physical Science
Basis” [Geneva: World Meterological
6
Association, 2007].)
5
1980 1985 1990 1995 2000 2005
Year
17-6 Circum-Arctic Warming evidence that those decades were relatively warm in the
Atlantic sector of the Arctic, at least in part because this
Perhaps the most dramatic climatic responses during interval was part of the early stage of the global warm-
recent decades are those in the Arctic Ocean and over ing trend. The extent of sea-ice retreat in recent years
nearby continents. The region north of 60°N has has now exceeded the losses during this earlier warm
warmed by an average of 1°C, with the largest warming interval.
over North America, but a small cooling over parts Satellite measurements from high latitudes of the
of Russia. This warming trend has been accompanied northern hemisphere also show other trends that are
by large changes in a number of climatically sensitive consistent with major regional warming. Satellite mea-
indices. surements show decreases of northern hemisphere
The average annual extent of sea ice in the Arctic snow cover (Figure 17–15), with earlier melting of snow
Ocean has decreased markedly since the late 1970s in spring and later initiation of snow cover in autumn.
(Figure 17–14). The minimum extent of sea ice occurs An additional indication of warming at high north-
in September at the end of the summer melt season. In ern latitudes comes from satellite and surface station
the three decades since the 1970s, the extent of summer measurements of the length of the growing season. Sur-
sea ice has decreased by ~25%, and losses accelerated in face measurements in central Alaska indicate an irregu-
the early 2000s. If this trend continues, summer sea ice lar increase in the growing season by two weeks over
will not exist in the Arctic by the middle of this century. the past 50 years (Figure 17–16). Satellite sensing of the
Until recently, the extent of winter sea ice had not chlorophyll produced by vegetation north of 45°N has
changed much, but significant decreases in winter sea also shown that by the mid–1990s the growing season
ice began to occur in the early 2000s. In addition, was beginning a week earlier in spring than it had in the
measurements made by acoustic soundings from sub-
marines show that the thickness of multiyear ice near
the center of the Arctic Ocean thinned by 40% between 40
the 1950s and mid–1990s, shrinking from just over 3 m
to less than 2 m. This 40% thinning, combined with the
25% shrinkage in area, translates into an even larger 38
loss in the total volume of sea ice. March– April snow cover (million km 2)
The satellite records of sea-ice extent are consistent 36
with the long-term warming indicated by surface
temperature measurements and other observations. Yet 34 1950 1975 2000
1925
even high-quality satellite records spanning several
decades need to be interpreted with some caution. Year
One complication is that shorter-term regional climatic FIGURE 17-15 Decrease in snow cover over the northern
changes that persist for a decade or longer may be hard hemisphere In the last several decades, satellite measure-
to distinguish from a long-term global warming trend. ments show a decrease of snow cover in the northern hemi-
For example, sparse observations indicate that sea- sphere. (Adapted from Intergovernmental Panel on Climate
ice limits were also reduced during the 1920s and Change, “Climate Change 2007: The Physical Science Basis”
1930s. These observations agree with ground station [Geneva: World Meterological Association, 2007].