
Page 344 - Earth's Climate Past and Future
P. 344
320 PART V • Historical and Future Climate Change
radiosondes are made of metal, their measurements
IN SUMMARY, a host of satellite measurements show of air temperature have to be corrected for heating of
that north polar regions have warmed dramatically. the metal by the Sun. Close examination showed an
These trends add to the already overwhelming overcorrection for solar heating, thus imposing a false
instrumental evidence that the planet has warmed cooling signal on the measurements. A more accurate
over the last 125 years, particularly during the last correction for the Sun’s heating showed a temperature
30–40 years.
trend that agreed well with ground stations.
With this problem resolved, scientists who argued
For a time, however, one of the most important mea- that global warming is not real lost one of their main
surements made from satellites did not agree with this supporting arguments. The full range of instrument
warming trend—measurements of the temperature of and satellite data now indicates that a major warming
the troposphere (the atmosphere below elevations of has occurred in the last century or more.
~10 km). Satellite data initially suggested no warming
since 1980 and perhaps even a small cooling, in dramatic Sources of the Recent Rise in Sea Level
contradiction to the evidence from surface stations.
Scientists skeptical about global warming pointed to We now have the information needed to return to the
these measurements as evidence that the temperature problem of the origin of the ~17-cm rise in average sea
trend assembled from the surface stations must be in level during the last century. This increase is primarily
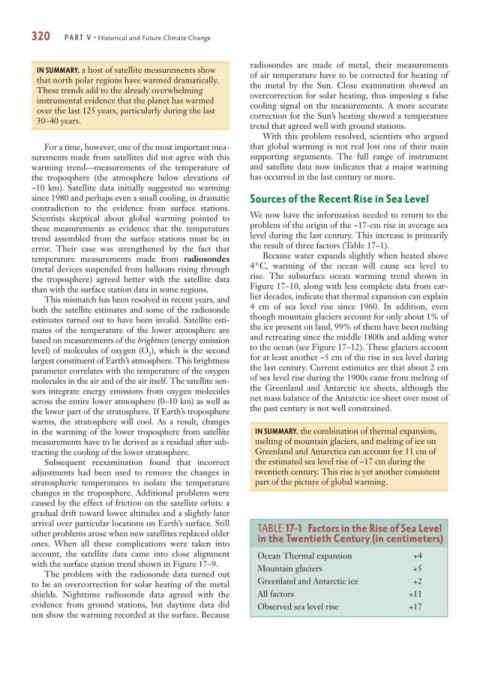
error. Their case was strengthened by the fact that the result of three factors (Table 17–1).
temperature measurements made from radiosondes Because water expands slightly when heated above
(metal devices suspended from balloons rising through 4°C, warming of the ocean will cause sea level to
the troposphere) agreed better with the satellite data rise. The subsurface ocean warming trend shown in
than with the surface station data in some regions. Figure 17–10, along with less complete data from ear-
This mismatch has been resolved in recent years, and lier decades, indicate that thermal expansion can explain
both the satellite estimates and some of the radiosonde 4 cm of sea level rise since 1960. In addition, even
estimates turned out to have been invalid. Satellite esti- though mountain glaciers account for only about 1% of
mates of the temperature of the lower atmosphere are the ice present on land, 99% of them have been melting
based on measurements of the brightness (energy emission and retreating since the middle 1800s and adding water
level) of molecules of oxygen (O ), which is the second to the ocean (see Figure 17–12). These glaciers account
2
largest constituent of Earth’s atmosphere. This brightness for at least another ~5 cm of the rise in sea level during
parameter correlates with the temperature of the oxygen the last century. Current estimates are that about 2 cm
molecules in the air and of the air itself. The satellite sen- of sea level rise during the 1900s came from melting of
sors integrate energy emissions from oxygen molecules the Greenland and Antarctic ice sheets, although the
across the entire lower atmosphere (0–10 km) as well as net mass balance of the Antarctic ice sheet over most of
the lower part of the stratosphere. If Earth’s troposphere the past century is not well constrained.
warms, the stratosphere will cool. As a result, changes
in the warming of the lower troposphere from satellite IN SUMMARY, the combination of thermal expansion,
measurements have to be derived as a residual after sub- melting of mountain glaciers, and melting of ice on
tracting the cooling of the lower stratosphere. Greenland and Antarctica can account for 11 cm of
Subsequent reexamination found that incorrect the estimated sea level rise of ~17 cm during the
adjustments had been used to remove the changes in twentieth century. This rise is yet another consistent
stratospheric temperatures to isolate the temperature part of the picture of global warming.
changes in the troposphere. Additional problems were
caused by the effect of friction on the satellite orbits: a
gradual drift toward lower altitudes and a slightly later
arrival over particular locations on Earth’s surface. Still TABLE 17-1 Factors in the Rise of Sea Level
other problems arose when new satellites replaced older in the Twentieth Century (in centimeters)
ones. When all these complications were taken into
account, the satellite data came into close alignment Ocean Thermal expansion +4
with the surface station trend shown in Figure 17–9. Mountain glaciers +5
The problem with the radiosonde data turned out
to be an overcorrection for solar heating of the metal Greenland and Antarctic ice +2
shields. Nighttime radiosonde data agreed with the All factors +11
evidence from ground stations, but daytime data did Observed sea level rise +17
not show the warming recorded at the surface. Because