
Page 343 - Earth's Climate Past and Future
P. 343
CHAPTER 17 • Climatic Changes Since the 1800s 319
160
beneath the ice was measured by labor-intensive efforts in
Growing season (days) 140 which recording stations moving across the ice surface
sent out radar waves that bounced off the bedrock and
returned to the station. The travel time of the radar pulses
is a direct measure of ice thickness. This time-consuming
technique could be used only to measure selected lines
across small portions of the ice sheets. More recently,
120
1960
1950
1940
1970
quickly and inexpensively from satellites, providing full
Year 1980 1990 2000 radar measurements of bedrock elevation have been made
coverage of these continent-sized masses of ice.
FIGURE 17-16 The growing season lengthens in Alaska In addition, surface stations installed in critical loca-
Surface temperature measurements indicate that the length of tions with global positioning receivers linked to satellites
the growing season increased in Alaska during the last half of measure both the elevation of the ice and the gravity
the twentieth century. (Adapted from S. W. Running et al., field (the strength of the pull of Earth’s gravity on the
“Radar Remote Sensing Proposed for Monitoring Freeze-Thaw satellite receiver). Because rock is almost three times
Transitions in Boreal Regions,” EOS 80 [1999]: 213–21.)
denser than ice, the gravity field at each station primarily
measures changes in the elevation of the underlying
bedrock in response to ice melting or growth. Thinning
early 1980s and that it was ending half a week later in of the ice allows the crust to rebound quickly because of
autumn. the elastic part of the response of Earth’s mantle to
unloading, while thickening of the ice depresses the
17-7 Ice Sheets crust for the same reason (see Chapter 9). This informa-
tion from the gravity data complements satellite and
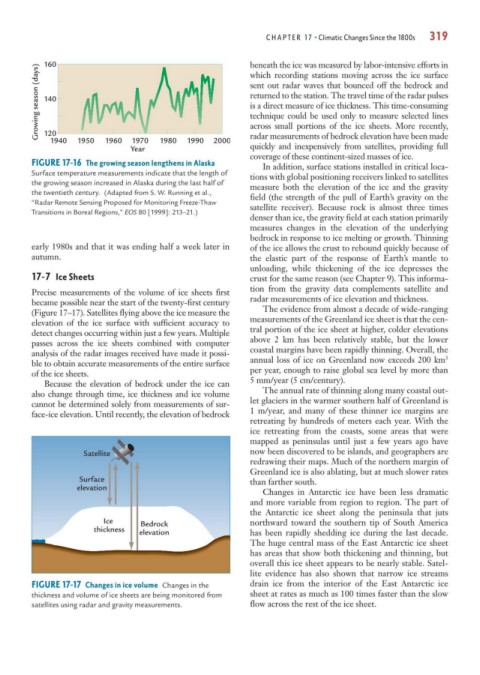
Precise measurements of the volume of ice sheets first
became possible near the start of the twenty-first century radar measurements of ice elevation and thickness.
(Figure 17–17). Satellites flying above the ice measure the The evidence from almost a decade of wide-ranging
elevation of the ice surface with sufficient accuracy to measurements of the Greenland ice sheet is that the cen-
detect changes occurring within just a few years. Multiple tral portion of the ice sheet at higher, colder elevations
passes across the ice sheets combined with computer above 2 km has been relatively stable, but the lower
analysis of the radar images received have made it possi- coastal margins have been rapidly thinning. Overall, the 3
ble to obtain accurate measurements of the entire surface annual loss of ice on Greenland now exceeds 200 km
of the ice sheets. per year, enough to raise global sea level by more than
Because the elevation of bedrock under the ice can 5 mm/year (5 cm/century).
also change through time, ice thickness and ice volume The annual rate of thinning along many coastal out-
cannot be determined solely from measurements of sur- let glaciers in the warmer southern half of Greenland is
face-ice elevation. Until recently, the elevation of bedrock 1 m/year, and many of these thinner ice margins are
retreating by hundreds of meters each year. With the
ice retreating from the coasts, some areas that were
mapped as peninsulas until just a few years ago have
Satellite now been discovered to be islands, and geographers are
redrawing their maps. Much of the northern margin of
Greenland ice is also ablating, but at much slower rates
Surface than farther south.
elevation
Changes in Antarctic ice have been less dramatic
and more variable from region to region. The part of
the Antarctic ice sheet along the peninsula that juts
Ice Bedrock northward toward the southern tip of South America
thickness elevation has been rapidly shedding ice during the last decade.
The huge central mass of the East Antarctic ice sheet
has areas that show both thickening and thinning, but
overall this ice sheet appears to be nearly stable. Satel-
lite evidence has also shown that narrow ice streams
FIGURE 17-17 Changes in ice volume Changes in the drain ice from the interior of the East Antarctic ice
thickness and volume of ice sheets are being monitored from sheet at rates as much as 100 times faster than the slow
satellites using radar and gravity measurements. flow across the rest of the ice sheet.