
Page 338 - Earth's Climate Past and Future
P. 338
314 PART V • Historical and Future Climate Change
20 intake valves that drew in seawater to cool the ship’s
Sea level change (cm) 10 growth in populations around many land stations. Near
engines.
15
On land, the largest complication has been the
large towns and cities, the spread of asphalt surfaces and
5
the loss of vegetation has led to increased absorption of
0
tion of heat at night. The result has been a significant
–5
1880 1900 1920 1940 1960 1980 2000 solar radiation during the day and greater back radia-
Year extra warming effect at these stations. Although this
warming reflects real temperature changes at these
FIGURE 17-7 Global rise in sea level during the twentieth stations, it is not characteristic of changes across much
century Sea level rose almost 20 cm during the twentieth more extensive rural areas. Care must be taken not
century because land ice has melted and seawater has warmed to project this bias, called the urban heat island
and expanded. (Adapted from B. C. Douglas, “Global Sea Rise: effect, into rural regions. Stations in regions of little or
A Redetermination,” Surveys in Geophysics, 28 [1997]: 279–92.)
no population growth provide a check on the heat
island effect. Adjusting for this bias reduced initial esti-
mates of warming trends during the last century by
about 30%.
Because this rise in sea level has been tied to several Reconstructions of global temperature during the
aspects of the warming that has occurred during the last last 150 years by different groups are very similar,
century or more, the next two sections explore the
instrumental and satellite evidence that document the
recent warming. At the end of the chapter, we return to
the issue of the cause of sea level rise. 1890
Other Instrumental Records
The “modern” era of instrumental measurements of
climate can be divided into two parts: (1) a recent era
extending back four decades or less in which changes
have been remotely sensed from satellites in space and
(2) an earlier era in which measurements of climate
were made using instruments invented during the era of
scientific exploration that began centuries ago. 1930
17-2 Thermometers: Surface Temperatures
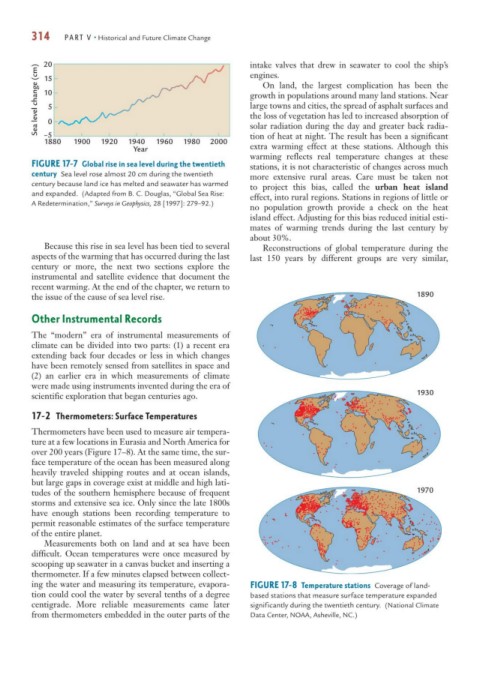
Thermometers have been used to measure air tempera-
ture at a few locations in Eurasia and North America for
over 200 years (Figure 17–8). At the same time, the sur-
face temperature of the ocean has been measured along
heavily traveled shipping routes and at ocean islands,
but large gaps in coverage exist at middle and high lati-
tudes of the southern hemisphere because of frequent 1970
storms and extensive sea ice. Only since the late 1800s
have enough stations been recording temperature to
permit reasonable estimates of the surface temperature
of the entire planet.
Measurements both on land and at sea have been
difficult. Ocean temperatures were once measured by
scooping up seawater in a canvas bucket and inserting a
thermometer. If a few minutes elapsed between collect-
ing the water and measuring its temperature, evapora- FIGURE 17-8 Temperature stations Coverage of land-
tion could cool the water by several tenths of a degree based stations that measure surface temperature expanded
centigrade. More reliable measurements came later significantly during the twentieth century. (National Climate
from thermometers embedded in the outer parts of the Data Center, NOAA, Asheville, NC.)