
Page 345 - Earth's Climate Past and Future
P. 345
CHAPTER 17 • Climatic Changes Since the 1800s 321
The rate of ice melting on Greenland has accelerated the overlying and underlying ocean layers are gradually
markedly since the 1990s. Satellite sensors deployed dur- bent into this channel from above and below because its
ing the last decade show more rapid melting along the temperature and density make the waves move slightly
lower margins of the Greenland ice sheet, especially in faster than in the surrounding layers. Scientists can use
the southern portions. Estimates of sea level change in these far-traveled sound waves to measure the average
future years will be much better constrained because of sound velocity across the paths the waves follow and
new instrumentation deployed in recent years. Satellites therefore the average temperature across large stretches
that have been measuring the altitude of the ocean surface of the subsurface ocean.
since 1992 (Figure 17–18 top) indicate a mean sea level
rise of 3 mm per year, or almost twice the 1.7 mm/year Shorter-Term Oscillations
average for the 1900s. When satellites have been measur-
ing the altitude of the sea surface for several more Several of the trends toward greater warmth during the
decades, it should be possible to see through shorter-term last century show oscillations or even small-scale rever-
changes in sea level caused by weather phenomena and El sals. For example, global temperature rose prior to the
Niño events and accurately quantify sea level rises caused 1940s but fell during the 1950s through the 1970s,
by the melting of land ice and warming of ocean water. before beginning the rapid rise that continues today. In
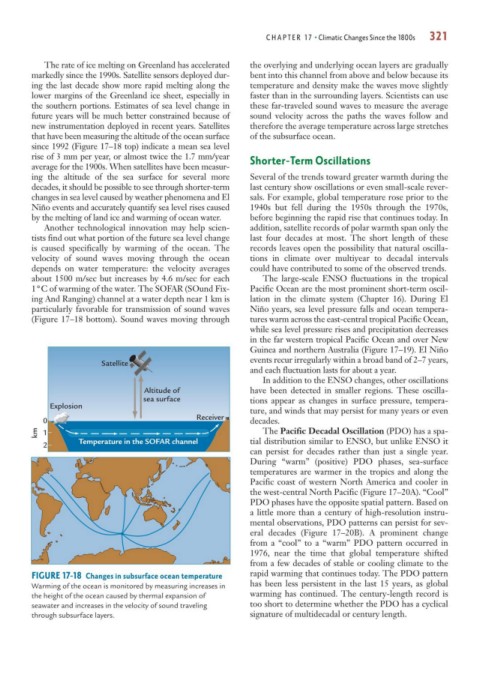
Another technological innovation may help scien- addition, satellite records of polar warmth span only the
tists find out what portion of the future sea level change last four decades at most. The short length of these
is caused specifically by warming of the ocean. The records leaves open the possibility that natural oscilla-
velocity of sound waves moving through the ocean tions in climate over multiyear to decadal intervals
depends on water temperature: the velocity averages could have contributed to some of the observed trends.
about 1500 m/sec but increases by 4.6 m/sec for each The large-scale ENSO fluctuations in the tropical
1°C of warming of the water. The SOFAR (SOund Fix- Pacific Ocean are the most prominent short-term oscil-
ing And Ranging) channel at a water depth near 1 km is lation in the climate system (Chapter 16). During El
particularly favorable for transmission of sound waves Niño years, sea level pressure falls and ocean tempera-
(Figure 17–18 bottom). Sound waves moving through tures warm across the east-central tropical Pacific Ocean,
while sea level pressure rises and precipitation decreases
in the far western tropical Pacific Ocean and over New
Guinea and northern Australia (Figure 17–19). El Niño
events recur irregularly within a broad band of 2–7 years,
Satellite
and each fluctuation lasts for about a year.
In addition to the ENSO changes, other oscillations
Altitude of have been detected in smaller regions. These oscilla-
sea surface tions appear as changes in surface pressure, tempera-
Explosion
ture, and winds that may persist for many years or even
Receiver
0 decades.
km 1 The Pacific Decadal Oscillation (PDO) has a spa-
Temperature in the SOFAR channel tial distribution similar to ENSO, but unlike ENSO it
2
can persist for decades rather than just a single year.
During “warm” (positive) PDO phases, sea-surface
temperatures are warmer in the tropics and along the
Pacific coast of western North America and cooler in
the west-central North Pacific (Figure 17–20A). “Cool”
PDO phases have the opposite spatial pattern. Based on
a little more than a century of high-resolution instru-
mental observations, PDO patterns can persist for sev-
eral decades (Figure 17–20B). A prominent change
from a “cool” to a “warm” PDO pattern occurred in
1976, near the time that global temperature shifted
from a few decades of stable or cooling climate to the
FIGURE 17-18 Changes in subsurface ocean temperature rapid warming that continues today. The PDO pattern
Warming of the ocean is monitored by measuring increases in has been less persistent in the last 15 years, as global
the height of the ocean caused by thermal expansion of warming has continued. The century-length record is
seawater and increases in the velocity of sound traveling too short to determine whether the PDO has a cyclical
through subsurface layers. signature of multidecadal or century length.