
Page 350 - Earth's Climate Past and Future
P. 350
326 PART V • Historical and Future Climate Change
Natural Causes of Recent Warming transition from greenhouse (ice-free) conditions to the
current icehouse state, Earth’s climate has cooled by at
A key question in the 0.7°C global warming since the most 5°–10°C over 100 Myr. The average rate of cool-
late 1800s is the role of natural changes in climate. A ing (~0.00001°C per century) has been much too slow
large contribution from natural changes would imply to produce any detectable effect on Earth’s climate
that the greenhouse-gas contribution was smaller, while a within just a century or so. Shorter intervals of faster
small contribution from natural forcing implies a larger tectonic-scale change also fall well short of the rates
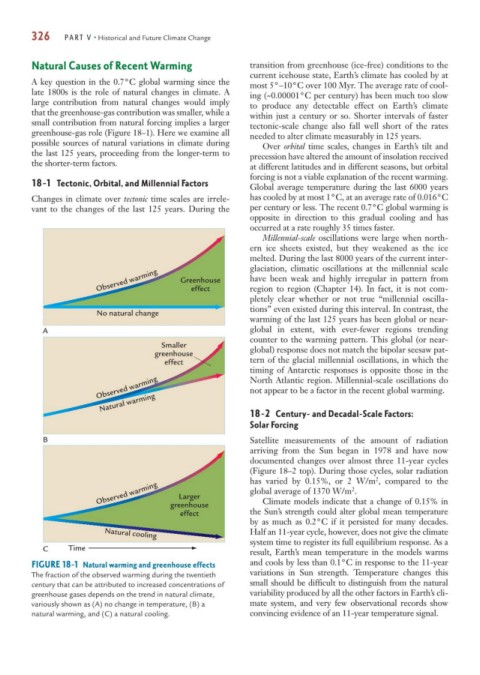
greenhouse-gas role (Figure 18–1). Here we examine all needed to alter climate measurably in 125 years.
possible sources of natural variations in climate during Over orbital time scales, changes in Earth’s tilt and
the last 125 years, proceeding from the longer-term to precession have altered the amount of insolation received
the shorter-term factors. at different latitudes and in different seasons, but orbital
forcing is not a viable explanation of the recent warming.
18-1 Tectonic, Orbital, and Millennial Factors Global average temperature during the last 6000 years
Changes in climate over tectonic time scales are irrele- has cooled by at most 1°C, at an average rate of 0.016°C
vant to the changes of the last 125 years. During the per century or less. The recent 0.7°C global warming is
opposite in direction to this gradual cooling and has
occurred at a rate roughly 35 times faster.
Millennial-scale oscillations were large when north-
ern ice sheets existed, but they weakened as the ice
melted. During the last 8000 years of the current inter-
glaciation, climatic oscillations at the millennial scale
Observed warming Greenhouse have been weak and highly irregular in pattern from
region to region (Chapter 14). In fact, it is not com-
effect
pletely clear whether or not true “millennial oscilla-
tions” even existed during this interval. In contrast, the
No natural change
warming of the last 125 years has been global or near-
A global in extent, with ever-fewer regions trending
counter to the warming pattern. This global (or near-
Smaller
greenhouse global) response does not match the bipolar seesaw pat-
effect tern of the glacial millennial oscillations, in which the
timing of Antarctic responses is opposite those in the
Observed warming North Atlantic region. Millennial-scale oscillations do
not appear to be a factor in the recent global warming.
Natural warming
18-2 Century- and Decadal-Scale Factors:
Solar Forcing
B Satellite measurements of the amount of radiation
arriving from the Sun began in 1978 and have now
documented changes over almost three 11-year cycles
(Figure 18–2 top). During those cycles, solar radiation
2
has varied by 0.15%, or 2 W/m , compared to the
Observed warming Larger global average of 1370 W/m .
2
greenhouse Climate models indicate that a change of 0.15% in
effect the Sun’s strength could alter global mean temperature
by as much as 0.2°C if it persisted for many decades.
Half an 11-year cycle, however, does not give the climate
Natural cooling
system time to register its full equilibrium response. As a
C Time result, Earth’s mean temperature in the models warms
FIGURE 18-1 Natural warming and greenhouse effects and cools by less than 0.1°C in response to the 11-year
The fraction of the observed warming during the twentieth variations in Sun strength. Temperature changes this
century that can be attributed to increased concentrations of small should be difficult to distinguish from the natural
greenhouse gases depends on the trend in natural climate, variability produced by all the other factors in Earth’s cli-
variously shown as (A) no change in temperature, (B) a mate system, and very few observational records show
natural warming, and (C) a natural cooling. convincing evidence of an 11-year temperature signal.