
Page 352 - Earth's Climate Past and Future
P. 352
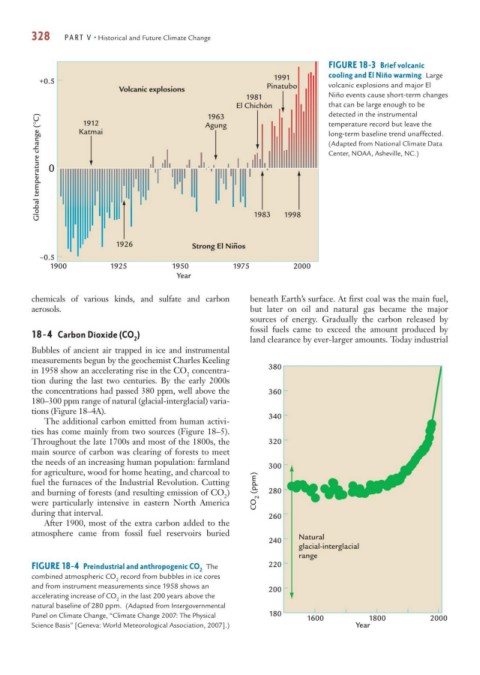
328     PART V • Historical and Future Climate Change


                                                                              FIGURE 18-3 Brief volcanic
                                                                  1991        cooling and El Niño warming Large
          +0.5                                                                volcanic explosions and major El
                             Volcanic explosions                Pinatubo
                                                           1981               Niño events cause short-term changes
                                                         El Chichon           that can be large enough to be
                                                                              detected in the instrumental
                                                  1963
          Global temperature change (°C)  0                                   (Adapted from National Climate Data
                    1912
                                                                              temperature record but leave the
                                                 Agung
                    Katmai
                                                                              long-term baseline trend unaffected.
                                                                              Center, NOAA, Asheville, NC.)


                            1926              Strong El Ninos  1983  1998
                                                        ~
          –0.5
             1900          1925           1950          1975          2000
                                           Year


        chemicals of various kinds, and sulfate and carbon  beneath Earth’s surface. At first coal was the main fuel,
        aerosols.                                           but later on oil and natural gas became the major
                                                            sources of energy. Gradually the carbon released by
                                                            fossil fuels came to exceed the amount produced by
        18-4 Carbon Dioxide (CO )
                                 2                          land clearance by ever-larger amounts. Today industrial
        Bubbles of ancient air trapped in ice and instrumental
        measurements begun by the geochemist Charles Keeling
        in 1958 show an accelerating rise in the CO concentra-  380
                                             2
        tion during the last two centuries. By the early 2000s
        the concentrations had passed 380 ppm, well above the   360
        180–300 ppm range of natural (glacial-interglacial) varia-
        tions (Figure 18–4A).                                   340
           The additional carbon emitted from human activi-
        ties has come mainly from two sources (Figure 18–5).
        Throughout the late 1700s and most of the 1800s, the    320
        main source of carbon was clearing of forests to meet
        the needs of an increasing human population: farmland   300
        for agriculture, wood for home heating, and charcoal to
        fuel the furnaces of the Industrial Revolution. Cutting
        and burning of forests (and resulting emission of CO )  CO 2  (ppm)  280
                                                      2
        were particularly intensive in eastern North America
        during that interval.                                   260
           After 1900, most of the extra carbon added to the
        atmosphere came from fossil fuel reservoirs buried
                                                                240    Natural
                                                                       glacial-interglacial
                                                                       range
        FIGURE 18-4 Preindustrial and anthropogenic CO The      220
                                                2
        combined atmospheric CO record from bubbles in ice cores
                            2
        and from instrument measurements since 1958 shows an    200
        accelerating increase of CO in the last 200 years above the
                            2
        natural baseline of 280 ppm. (Adapted from Intergovernmental
        Panel on Climate Change, “Climate Change 2007: The Physical  180  1600          1800          2000
        Science Basis” [Geneva: World Meteorological Association, 2007].)            Year