
Page 351 - Earth's Climate Past and Future
P. 351
CHAPTER 18 • Causes of Warming over the Last 125 Years 327
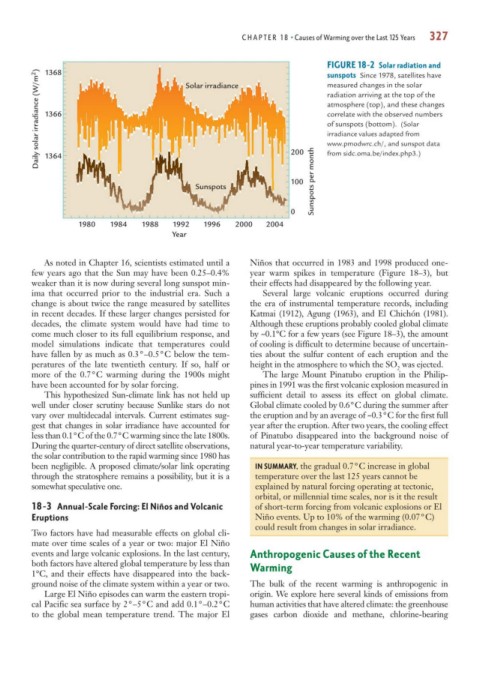
FIGURE 18-2 Solar radiation and
Daily solar irradiance (W/m 2 ) 1366 radiation arriving at the top of the
1368
sunspots Since 1978, satellites have
measured changes in the solar
Solar irradiance
atmosphere (top), and these changes
correlate with the observed numbers
of sunspots (bottom). (Solar
irradiance values adapted from
www.pmodwrc.ch/, and sunspot data
200
1364
100 Sunspots per month from sidc.oma.be/index.php3.)
Sunspots
0
1980 1984 1988 1992 1996 2000 2004
Year
As noted in Chapter 16, scientists estimated until a Niños that occurred in 1983 and 1998 produced one-
few years ago that the Sun may have been 0.25–0.4% year warm spikes in temperature (Figure 18–3), but
weaker than it is now during several long sunspot min- their effects had disappeared by the following year.
ima that occurred prior to the industrial era. Such a Several large volcanic eruptions occurred during
change is about twice the range measured by satellites the era of instrumental temperature records, including
in recent decades. If these larger changes persisted for Katmai (1912), Agung (1963), and El Chichón (1981).
decades, the climate system would have had time to Although these eruptions probably cooled global climate
come much closer to its full equilibrium response, and by ~0.1°C for a few years (see Figure 18–3), the amount
model simulations indicate that temperatures could of cooling is difficult to determine because of uncertain-
have fallen by as much as 0.3°–0.5°C below the tem- ties about the sulfur content of each eruption and the
peratures of the late twentieth century. If so, half or height in the atmosphere to which the SO was ejected.
2
more of the 0.7°C warming during the 1900s might The large Mount Pinatubo eruption in the Philip-
have been accounted for by solar forcing. pines in 1991 was the first volcanic explosion measured in
This hypothesized Sun-climate link has not held up sufficient detail to assess its effect on global climate.
well under closer scrutiny because Sunlike stars do not Global climate cooled by 0.6°C during the summer after
vary over multidecadal intervals. Current estimates sug- the eruption and by an average of ~0.3°C for the first full
gest that changes in solar irradiance have accounted for year after the eruption. After two years, the cooling effect
less than 0.1°C of the 0.7°C warming since the late 1800s. of Pinatubo disappeared into the background noise of
During the quarter-century of direct satellite observations, natural year-to-year temperature variability.
the solar contribution to the rapid warming since 1980 has
been negligible. A proposed climate/solar link operating IN SUMMARY, the gradual 0.7°C increase in global
through the stratosphere remains a possibility, but it is a temperature over the last 125 years cannot be
somewhat speculative one. explained by natural forcing operating at tectonic,
orbital, or millennial time scales, nor is it the result
18-3 Annual-Scale Forcing: El Niños and Volcanic of short-term forcing from volcanic explosions or El
Eruptions Niño events. Up to 10% of the warming (0.07°C)
could result from changes in solar irradiance.
Two factors have had measurable effects on global cli-
mate over time scales of a year or two: major El Niño
events and large volcanic explosions. In the last century, Anthropogenic Causes of the Recent
both factors have altered global temperature by less than Warming
1°C, and their effects have disappeared into the back-
ground noise of the climate system within a year or two. The bulk of the recent warming is anthropogenic in
Large El Niño episodes can warm the eastern tropi- origin. We explore here several kinds of emissions from
cal Pacific sea surface by 2°–5°C and add 0.1°–0.2°C human activities that have altered climate: the greenhouse
to the global mean temperature trend. The major El gases carbon dioxide and methane, chlorine-bearing