
Page 353 - Earth's Climate Past and Future
P. 353
CHAPTER 18 • Causes of Warming over the Last 125 Years 329
8 phere, no one measurement in the ocean can provide a
representative history of the average change in ocean
Carbon emissions (gigatons/year) 4 ments in many areas are needed to characterize its aver-
CO concentrations through time. Because the ocean
2
is not as well mixed as the atmosphere, many measure-
6
age change in CO content.
2
The excess CO from human activities has already
2
been well mixed into the upper tens of meters of the
ocean, which quickly exchange molecules of gas with
the atmosphere. By comparison, the shallow subsurface
2
atmosphere, and most of the deeper ocean below 1 km
is even more isolated from the surface. As a result,
fuels
Land clearance Fossil ocean below 100 m is more out of touch with the
smaller amounts of the excess CO produced in the last
0 2
1800 1900 2000 two centuries have penetrated below 100 m, and very
Year little has entered the deep ocean except in regions of
FIGURE 18-5 Human production of CO Two factors active turnover like the subpolar North Atlantic Ocean.
2
account for the increase in atmospheric CO caused by human Even in the surface layer of the ocean, the exchanges
2
activities in the last 250 years: (1) burning of carbon in trees to vary by region and by season. On an annual average,
clear land for agriculture and (2) burning of carbon in fossil cold high-latitude ocean water acts as a net CO sink
2
fuels—coal, oil, and gas. (Adapted from H. S. Kheshgi et al., and takes CO from the atmosphere, while warm low-
2
“Accounting for the Missing Carbon Sink with the CO - latitude ocean surfaces act as a CO source and give
2 2
Fertilization Effect,” Climate Change 33 [1996]: 31–62, and from some of it back (Figure 18–7). One reason for this pat-
data in T. A. Boden et al., Trends ’91: A Compilation of Data on Global tern is that CO gas is more easily dissolved in cold
2
Change, ornl/cdiac–46 [Oak Ridge, TN: Oak Ridge National water than in warm water. Local air-sea exchanges are
Laboratory, 1991].) also governed by the relative concentration of CO in
2
the surface ocean versus the overlying atmosphere, and
by other physical and biochemical processes that con-
carbon emissions (mostly in the northern hemisphere) trol carbon exchanges with subsurface waters.
account for most of the fossil fuel total, while cutting For all these reasons, huge numbers of measure-
and burning of tropical rain forests are the largest ments made over vast regions of the ocean during all
land-clearance contribution. seasons are required to quantify the slow penetration of
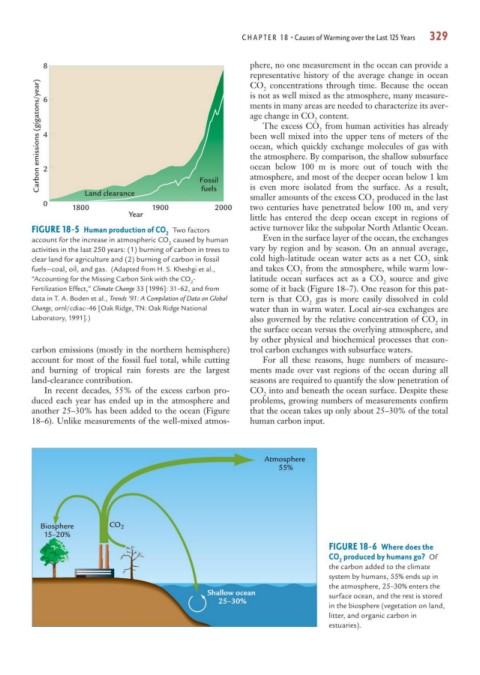
In recent decades, 55% of the excess carbon pro- CO into and beneath the ocean surface. Despite these
2
duced each year has ended up in the atmosphere and problems, growing numbers of measurements confirm
another 25–30% has been added to the ocean (Figure that the ocean takes up only about 25–30% of the total
18–6). Unlike measurements of the well-mixed atmos- human carbon input.
Atmosphere
55%
Biosphere CO 2
15–20%
FIGURE 18-6 Where does the
CO produced by humans go? Of
2
the carbon added to the climate
system by humans, 55% ends up in
the atmosphere, 25–30% enters the
Shallow ocean surface ocean, and the rest is stored
25–30%
in the biosphere (vegetation on land,
litter, and organic carbon in
estuaries).