
Page 354 - Earth's Climate Past and Future
P. 354
330 PART V • Historical and Future Climate Change
increased this fertilization effect and taken more carbon
from the atmosphere through several mechanisms. The
vegetation grows faster; it becomes more varied in
composition and grows more densely; the amount of
woody material in tree branches, trunks, and roots
increases; and trees and shrubs shed more fresh carbon
litter into soils and coastal estuaries.
IN SUMMARY, ice cores and instrumental measurements
show that atmospheric CO levels have risen by ~35%
2
in the last 200 years. This increase accounted for
more than 60% of the total observed increase in the
Sink CO Source
2
greenhouse-gas effect. Because greenhouse gases trap
FIGURE 18-7 Ocean sources and sinks of CO Annually outgoing radiation from Earth’s surface, the rising
2
averaged CO concentrations in ocean surface waters are close CO levels have warmed the planet.
2 2
to those in the overlying atmosphere, but the higher-latitude
oceans act as net sinks that absorb carbon from the
atmosphere, while the tropical oceans are net sources that give
4
some of it back. (Adapted from T. Takahashi et al., “Global Air- 18-5 Methane (CH )
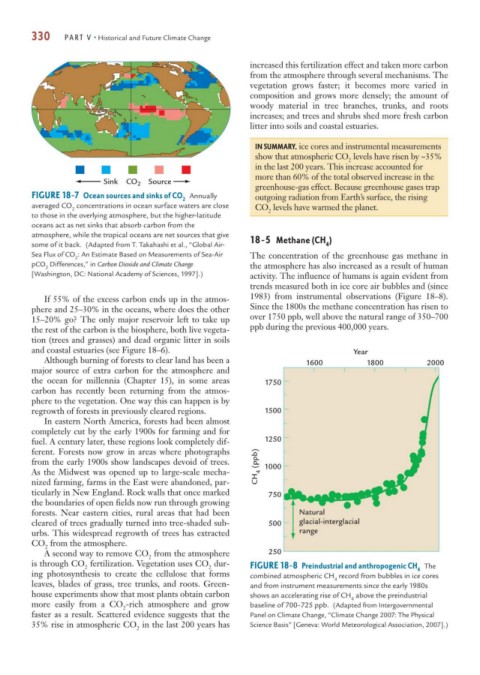
Sea Flux of CO : An Estimate Based on Measurements of Sea-Air The concentration of the greenhouse gas methane in
2
pCO Differences,” in Carbon Dioxide and Climate Change the atmosphere has also increased as a result of human
2
[Washington, DC: National Academy of Sciences, 1997].) activity. The influence of humans is again evident from
trends measured both in ice core air bubbles and (since
If 55% of the excess carbon ends up in the atmos- 1983) from instrumental observations (Figure 18–8).
phere and 25–30% in the oceans, where does the other Since the 1800s the methane concentration has risen to
15–20% go? The only major reservoir left to take up over 1750 ppb, well above the natural range of 350–700
the rest of the carbon is the biosphere, both live vegeta- ppb during the previous 400,000 years.
tion (trees and grasses) and dead organic litter in soils
and coastal estuaries (see Figure 18–6). Year
Although burning of forests to clear land has been a 1600 1800 2000
major source of extra carbon for the atmosphere and
the ocean for millennia (Chapter 15), in some areas 1750
carbon has recently been returning from the atmos-
phere to the vegetation. One way this can happen is by
regrowth of forests in previously cleared regions. 1500
In eastern North America, forests had been almost
completely cut by the early 1900s for farming and for
fuel. A century later, these regions look completely dif- 1250
ferent. Forests now grow in areas where photographs
from the early 1900s show landscapes devoid of trees. CH 4 (ppb) 1000
As the Midwest was opened up to large-scale mecha-
nized farming, farms in the East were abandoned, par-
ticularly in New England. Rock walls that once marked 750
the boundaries of open fields now run through growing
forests. Near eastern cities, rural areas that had been Natural
cleared of trees gradually turned into tree-shaded sub- 500 glacial-interglacial
urbs. This widespread regrowth of trees has extracted range
CO from the atmosphere.
2
A second way to remove CO from the atmosphere 250
2
is through CO fertilization. Vegetation uses CO dur-
2 2 FIGURE 18-8 Preindustrial and anthropogenic CH The
4
ing photosynthesis to create the cellulose that forms combined atmospheric CH record from bubbles in ice cores
4
leaves, blades of grass, tree trunks, and roots. Green- and from instrument measurements since the early 1980s
house experiments show that most plants obtain carbon shows an accelerating rise of CH above the preindustrial
4
more easily from a CO -rich atmosphere and grow baseline of 700–725 ppb. (Adapted from Intergovernmental
2
faster as a result. Scattered evidence suggests that the Panel on Climate Change, “Climate Change 2007: The Physical
35% rise in atmospheric CO in the last 200 years has Science Basis” [Geneva: World Meteorological Association, 2007].)
2