
Page 383 - Earth's Climate Past and Future
P. 383
Appendix 1
Isotopes of Oxygen
Oxygen is present in abundance in several key parts of
Earth’s climate system: as the second most abundant gas Poles Middle latitudes Tropics
(O ) in the atmosphere, as water vapor (H O ) in the
2 2 v Ice
atmosphere, as a component of water molecules (H O)
2 –30 –55
in the ocean and in lakes, and as frozen water in ice River –15 Surface 0 –2
sheets. These reservoirs interact with each other and ocean
exchange oxygen. 18 Deep ocean +3 +4
Oxygen occurs in nature mainly as two isotopes. Typical δ 0 values (‰)
16
The lighter O isotope accounts for almost 99.8% of
18
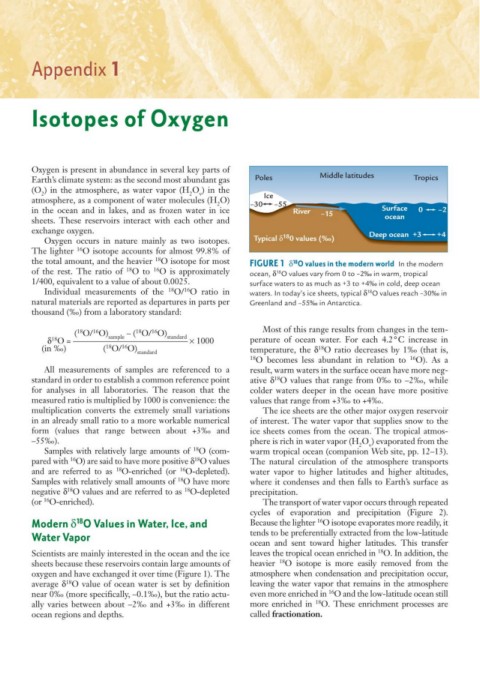
the total amount, and the heavier O isotope for most FIGURE 1 δ O values in the modern world In the modern
18
18
16
of the rest. The ratio of O to O is approximately ocean, δ O values vary from 0 to –2‰ in warm, tropical
18
1/400, equivalent to a value of about 0.0025. surface waters to as much as +3 to +4‰ in cold, deep ocean
18
16
Individual measurements of the O/ O ratio in waters. In today’s ice sheets, typical δ O values reach –30‰ in
18
natural materials are reported as departures in parts per Greenland and –55‰ in Antarctica.
thousand (‰) from a laboratory standard:
16
16
18
18
( O/ O) sample – ( O/ O) standard Most of this range results from changes in the tem-
18
δ O = –––––––––––––––––––––––––––––– × 1000 perature of ocean water. For each 4.2°C increase in
16
18
(in ‰) ( O/ O) temperature, the δ O ratio decreases by 1‰ (that is,
18
standard
18 O becomes less abundant in relation to O). As a
16
All measurements of samples are referenced to a result, warm waters in the surface ocean have more neg-
18
standard in order to establish a common reference point ative δ O values that range from 0‰ to –2‰, while
for analyses in all laboratories. The reason that the colder waters deeper in the ocean have more positive
measured ratio is multiplied by 1000 is convenience: the values that range from +3‰ to +4‰.
multiplication converts the extremely small variations The ice sheets are the other major oxygen reservoir
in an already small ratio to a more workable numerical of interest. The water vapor that supplies snow to the
form (values that range between about +3‰ and ice sheets comes from the ocean. The tropical atmos-
–55‰). phere is rich in water vapor (H O ) evaporated from the
2
v
18
Samples with relatively large amounts of O (com- warm tropical ocean (companion Web site, pp. 12–13).
16
18
pared with O) are said to have more positive δ O values The natural circulation of the atmosphere transports
18
16
and are referred to as O-enriched (or O-depleted). water vapor to higher latitudes and higher altitudes,
18
Samples with relatively small amounts of O have more where it condenses and then falls to Earth’s surface as
18
18
negative δ O values and are referred to as O-depleted precipitation.
16
(or O-enriched). The transport of water vapor occurs through repeated
cycles of evaporation and precipitation (Figure 2).
16
18
Modern δ O Values in Water, Ice, and Because the lighter O isotope evaporates more readily, it
tends to be preferentially extracted from the low-latitude
Water Vapor
ocean and sent toward higher latitudes. This transfer
18
Scientists are mainly interested in the ocean and the ice leaves the tropical ocean enriched in O. In addition, the
18
sheets because these reservoirs contain large amounts of heavier O isotope is more easily removed from the
oxygen and have exchanged it over time (Figure 1). The atmosphere when condensation and precipitation occur,
18
average δ O value of ocean water is set by definition leaving the water vapor that remains in the atmosphere
16
near 0‰ (more specifically, –0.1‰), but the ratio actu- even more enriched in O and the low-latitude ocean still
18
ally varies between about –2‰ and +3‰ in different more enriched in O. These enrichment processes are
ocean regions and depths. called fractionation.