
Page 385 - Earth's Climate Past and Future
P. 385
APPENDIX 1 • Isotopes of Oxygen 361
Sediment samples taken from the ocean are sieved 18
to remove the mud and silt in order to isolate the sand- TABLE 1 Causes of δ O Changes
sized fraction from which foraminifera are individually Recorded in Ice Cores
18
picked. Typical δ O analyses require a few milligrams Negative Change in Positive
of sample, usually less than a dozen foraminifera. The δ O values
18
CaCO shells are dissolved in acid to produce CO gas,
3 2
which is then analyzed in a mass spectrometer, an Colder Air temperature Warmer
instrument capable of detecting the small difference in over ice
atomic mass between the O and O isotopes. Distant Proximity of Close
16
18
source region
Climatic Application 2: Changes in Ice Low δ O δ O composition High δ O
18
18
18
18
Sheet δ O of source
High Elevation of ice Low
Changes in δ O values of layers in the ice sheets are also
18
important to studies of past climate. Samples are drilled Winter Primary season of Summer
out of ice cores and melted, and the water is vaporized to precipitation
form the gas H O for analysis on mass spectrometers.
2 v
The δ O values within ice sheets can vary by 5‰ or
18
more as climate changes. In the ice, more negative ture of the snow that precipitates on the ice sheets.
values are typical of colder climates and less negative val- “Warm” (wet) snow can form at temperatures near
ues indicate warmer climates. In Greenland, interglacial freezing, but cold (dry, powdery) snow forms at much
values typically vary between –30‰ and –35‰, while colder temperatures. The δ O value of snow falling on
18
glacial values fall between –35‰ and –40‰. In Antarc- Greenland today trends 0.7‰ more negative with each
tica, interglacial values are typically between –50‰ 1°C drop in the temperature of the air in which it
and –55‰, while glacial values fall between –55‰ and forms. This temperature/δ O relationship holds for
18
18
–60‰. Note that the δ O responses of the ocean and today’s seasonal changes in the temperature of the air
18
the ice sheets are opposite in direction: as marine δ O masses that deliver the snow, and also for the cooling of
values become more positive during glacial climates, air at higher elevations on the ice sheets. But this rela-
the δ O values in ice cores become more negative (and tionship did not always apply in the past: δ O values of
18
18
conversely). glacial-age ice in Greenland suggest temperatures
These δ O changes in the ice sheet layers reflect about 10°C colder than those today, but direct mea-
18
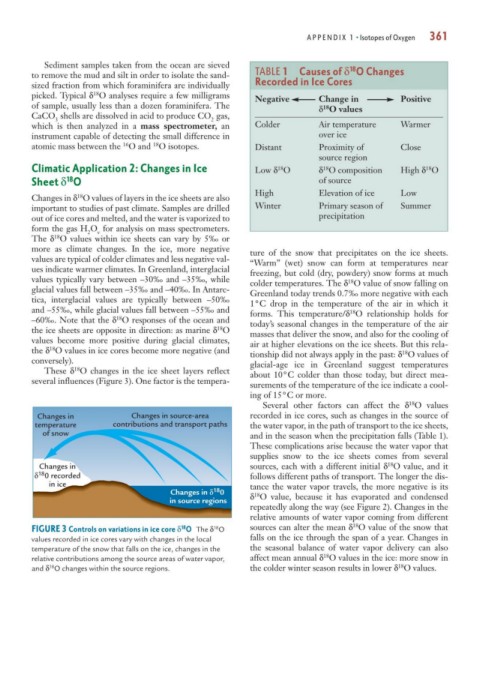
several influences (Figure 3). One factor is the tempera-
surements of the temperature of the ice indicate a cool-
ing of 15°C or more.
18
Several other factors can affect the δ O values
Changes in Changes in source-area recorded in ice cores, such as changes in the source of
temperature contributions and transport paths the water vapor, in the path of transport to the ice sheets,
of snow and in the season when the precipitation falls (Table 1).
These complications arise because the water vapor that
supplies snow to the ice sheets comes from several
18
Changes in sources, each with a different initial δ O value, and it
18
δ 0 recorded follows different paths of transport. The longer the dis-
in ice tance the water vapor travels, the more negative is its
18
Changes in δ 0 18
in source regions δ O value, because it has evaporated and condensed
repeatedly along the way (see Figure 2). Changes in the
relative amounts of water vapor coming from different
18
18
18
FIGURE 3 Controls on variations in ice core δ O The δ O sources can alter the mean δ O value of the snow that
values recorded in ice cores vary with changes in the local falls on the ice through the span of a year. Changes in
temperature of the snow that falls on the ice, changes in the the seasonal balance of water vapor delivery can also
18
relative contributions among the source areas of water vapor, affect mean annual δ O values in the ice: more snow in
18
18
and δ O changes within the source regions. the colder winter season results in lower δ O values.